Parabolic SAR Alert
"Parabolic SAR Alert" logo
5.0
21/08/2025
1
Desktop
SinceĀ 14/07/2025
Sales
26
"Parabolic SAR Alert" uploaded image"Parabolic SAR Alert" uploaded image"Parabolic SAR Alert" uploaded image

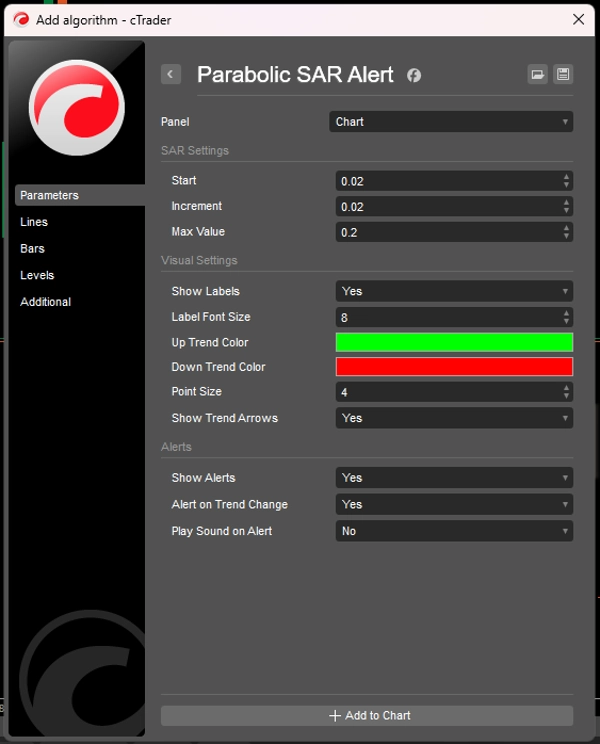
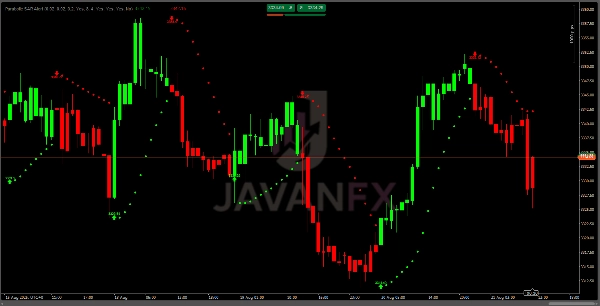
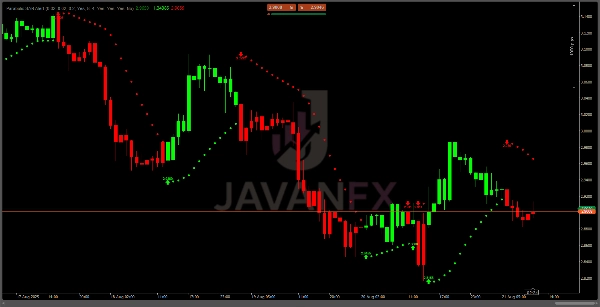
This indicator tracks price trends and identifies potential reversals using the renowned Parabolic SAR algorithm. Customizable with adjustable start, increment, and maximum values, it features vibrant color-coded signals (lime for uptrends, red for downtrends) and optional labels to mark trend changes. Perfect for forex, stocks, and other markets, it includes built-in alerts to notify you of trend shifts, ensuring you never miss a critical move.

 WHO NEEDS THIS INDICATOR?

  • Traders struggling to identify trend changes
  • Professionals wanting reliable reversal signals
  • Beginners seeking clear visual trading guidance
  • Algorithmic traders needing precise trigger points
  • Anyone tired of missing major market turns

ā° TIMEFRAME OPTIMIZATION:

Scalping (1-5 minute charts):

Start: 0.01-0.015
Increment: 0.015-0.02
Maximum: 0.1-0.15

Day Trading (15-30 minute charts):

Start: 0.02-0.03
Increment: 0.02-0.03
Maximum: 0.15-0.2

Swing Trading (1-4 hour charts):

Start: 0.03-0.04
Increment: 0.03-0.04
Maximum: 0.2-0.25


Multi-Timeframe Analysis:

  • Apply indicator to higher timeframe for trend direction
  • Use lower timeframe for precise entry timing
  • Perfect for confluence trading

Combine with:

  • Moving Averages for trend confirmation
  • RSI/MACD for momentum validation
  • Support/Resistance levels for better entries
  • Volume indicators for strength confirmation

🚨 PRO TIPS:

  1. Avoid Choppy Markets: SAR performs best in trending conditions
  2. Wait for Confirmation: Don't enter on first dot flip - wait for price confirmation
  3. Use Multiple Timeframes: Higher timeframe SAR direction determines bias
  4. Adjust Parameters: Fine-tune settings for different instruments
  5. Backtest First: Test strategies before live trading

Good Luck!!

5.0
Reviews: 1
5
100 %
4
0 %
3
0 %
2
0 %
1
0 %
Customer reviews
October 10, 2025
Classic SAR with a modern twist šŸš€ — alerts keep you sharp on reversals. Simple, fast, and rock-solid. Great for trend riders who hate missing the flip!
More from this author
Pivot Point Super Trend
Laser entries with pivot confirmation. No repaint, all timeframes. Professional results.
Alpha Sentiment Pro
Alpha Sentiment Pro - See the Market's Pulse Before It Moves
Zero Lag LSMA
ZLSMA: Zero-lag trend indicator! Catch trends fast with customizable settings. Boost your trading precision.
Parabolic RSI AlertĀ  V1
Master RSI reversals with Parabolic SAR precision! Get real-time alerts for high-probability trend changes.
MA Sabres
Conquer the markets with MA Sabres! This indicator spots trend flips with MAs and cool Sabre shapes & alerts.
Bollinger Bands Breakout Oscillator (+ Alerts)
BB Breakout Oscillator with alerts! Spot trend reversals using Bollinger Bands. Bullish/Bearish crossovers Alerts.
Indicator
Indices
Commodities
Stocks
+4
UT Bot Alert
A powerful ATR-based indicator generating clear BUY/SELL signals. Features real-time alerts and customizable sensitivity
Trend Direction Force Index - TDFI (Alerts)
Spot Strong Trends Early & Filter Market Noise
Indicator
Indices
Stocks
ATR
+5
UT Bot Alerts Nova
UT Bot Alerts Nova: Advanced trend-following indicator using ATR for signals. Precise entries/exits.
You may also like
Indicator
Breakout
ATR
Signal
[Stellar Strategies] Market Structure Breakout
Flags breakouts of recent highs/lows on cTrader charts. Shows arrows/lines. Optional trend filter & sound alerts šŸ“‰šŸ“ˆ
Anchored VWAP Buttons
ADVANCED ICT + ADR + AWR SUITE PRO
ADVANCED ICT + ADR + AWR SUITE PRO (The Ultimate All-in-One Toolkit for Price Action Traders)
Indicator
NAS100
NZDUSD
XAUUSD
+14
MacD Custom Indicator Multi Time Frame
MacD Custom Indicator-Multiple Time Frame+All Available Options!
IR Moving Average
Ā this moving include everything that a trader needs from Moving Average.
SmartLiquidityZonesPRO
Smart Liquidity Zones PRO auto-detects liquidity grabs, wicks, traps & manipulations — trade like the smart money.
MAMA CANDLES
This code implements the MESA Adaptive Moving Average (MAMA) indicator, it creates candles based on MAMA calculations.
Indicator
RSI
Breakout
XAUUSD
+5
Zones Supply Demand
šŸ“ŠZones Supply & Demand: Identifies key price levels with high volume concentration, marking Supply/Demand Zones & Marke
Indicator
NAS100
RSI
NZDUSD
+15
Inside Candle
Highlight market consolidation zones instantly with this Inside Candle indicator — precise, clean, and powerful.
[Stellar Strategies] Market Session Ultimate
Ultimate Session Tool: Boxes, OR, KZs, PD Levels, Overlaps, Custom Lines & Names, Info Panel! Highly customizable šŸ“‰šŸ“ˆ
Indicator
Breakout
PDHL
PDHL - Previous Day High&Low
Indicator
NAS100
Indices
Prop
+6
VolumeThermometer
Heatmap of intra-HTF volume (POC/VA) built from LTF tick data; paints current candle and auto-loads visible history.
Fisher_m11
Fisher Transform with smoothing. Spot reversals and cycles with precision. Great for any market, any timeframe.
High TF Plotter
Captra High TF Plotter visualizes high timeframe Bar on lower timeframe charts, highlighting with bull/bear colors.
Indicator
Breakout
Stocks
Commodities
+1
Advanced Donchian Zones
MTF Donchian: Identify trend breakouts & key zones with precision. Perfect for swing & day traders seeking accuracy!
Indicator
RSI
Breakout
XAUUSD
+7
Candle Strength Oscillator
The Candle Pressure Index is a powerful, user-friendly indicator that reveals hidden market pressure inside candles.
Repiptor RSI Amplified
RSI Amplified
Indicator
Indices
Breakout
Commodities
+3
Daily Levels
The "Daily Levels" indicator is used to display last week's and yestoday high/low price