
HTFBB
Indicator
1 purchases
Version 1.0, Jul 2025
Windows, Mac
5.0
Reviews: 1
Description
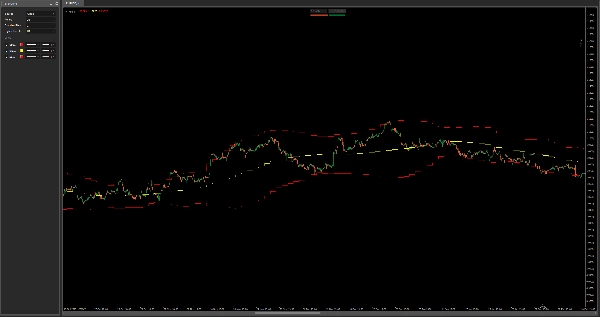
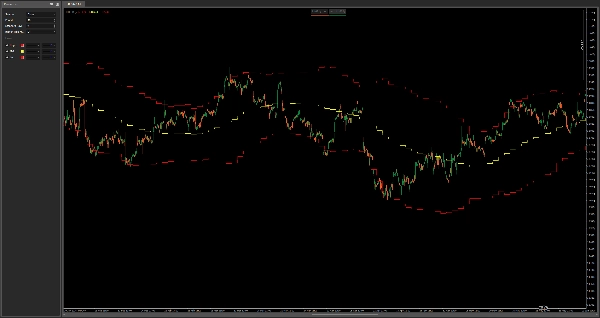
HTF Bollinger Bands – Multi-Timeframe Volatility Map
This indicator plots Bollinger Bands from a higher timeframe onto your current chart, giving you powerful context for volatility, mean reversion, and dynamic support/resistance—all without switching timeframes.
Features:
- Displays upper, middle, and lower Bollinger Bands from any selectable higher timeframe
- Great for spotting HTF consolidation zones, breakout pressure, and trend pullbacks
- Ideal for scalping and intraday entries with higher timeframe awareness
- Works on all assets and timeframes
Combine with your current strategy to avoid trading into volatility traps and stay aligned with macro price structure.
Summary
Indicator profile
Customer reviews
5.0
Reviews: 1
5 | 100 % | |
4 | 0 % | |
3 | 0 % | |
2 | 0 % | |
1 | 0 % |
Customer reviews
July 29, 2025
confusing signals get easier to ignore, but a clean signal can still fail.
Discussion
FAQ
Products available through cTrader Store, including trading bots, indicators and plugins, are provided by third-party developers and made available for informational and technical access purposes only. cTrader Store is not a broker and does not provide investment advice, personal recommendations or any guarantee of future performance.


Price
Since 03/01/2025
638.03K
Traded volume
21.34K
Pips won
15
Sales