VixFix
"VixFix" logo
19/07/2025
Desktop
Since 03/01/2025
Sales
3

VixFix Indicator for cTrader

Catch Market Panic Before It Hits the News.

This VixFix indicator is a smart adaptation of Larry Williams’ classic “VIX Fix” concept—designed to help traders detect short-term fear and volatility spikes, especially useful in identifying potential market bottoms.

How It Works

  • Calculates a pseudo-volatility spike by comparing the recent low to the highest high over a configurable period (default: 12).
  • Applies a moving average and standard deviation envelope to separate signal spikes from normal noise.
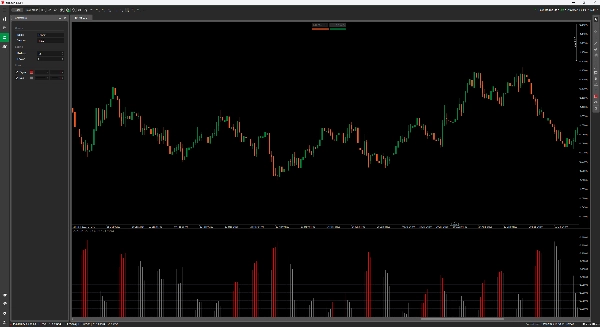
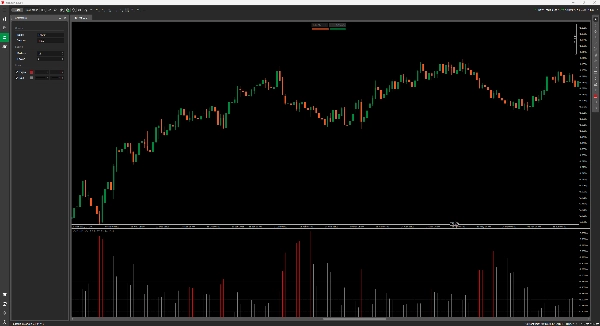
  • Plots red histogram bars when volatility exceeds the threshold—your cue to start paying attention.

Features

  • Clean histogram display (non-overlay)
  • Two-color plot:
    • Red = Signal (volatility spike above threshold)
    • Gray = Normal activity
  • Adjustable periods and sensitivity factor
  • Zero indicator lag—uses raw price action only, no repainting

Use Cases

  • Spot potential reversals in downtrends
  • Time mean-reversion trades
  • Confirm oversold conditions without relying on RSI or other laggy tools
More from this author
SwingHighLow
Auto-detect swing highs/lows. Spot reversals, map structure, and filter noise with adjustable strength.
Fisher_m11
Fisher Transform with smoothing. Spot reversals and cycles with precision. Great for any market, any timeframe.
LaguerreRSI
Laguerre RSI: smoother, faster RSI with less noise. Great for spotting reversals and timing entries.
HTFBB
Plot higher-timeframe Bollinger Bands for clearer structure, pullback zones, and breakout signals—without switching char
SupertrendHTF
Overlay higher-timeframe SuperTrend to filter noise, follow real trends, and avoid lower-timeframe whipsaws. As
SupertrendChannels
Supertrend-based channel for entries, trailing stops, and dynamic support/resistance zones.
TrendMagicOptimized
Clean trend indicator using CCI & ATR. Highlights up/down trends with adaptive, no-repaint lines.
IBSBot
Buy-only IBS bot for indices on Daily timeframe. Enters near lows, exits near highs. No noise, just clean reversion.
You may also like
Indicator
Stocks
Commodities
Forex
buy sell
SmartSignal Pro: Precise BUY/SELL signals to profit in any market. Trade like a pro! 🚀
Indicator
VWAP
Indices
Forex
TPO Profile v2.0
TPO Profile v2.0
Indicator
Indices
XAUUSD
Commodities
+8
ATR on Chart
Plots the ATR on the chart for easy visualization.
Larry Williams 9.1
Larry Williams 9.1
Indicator
Grid
Martingale
Signal
+2
Trend Pulse X
is a trend-following indicator designed to provide a clear view of market direction, momentum, and strength
SmartBot-Tenkan & ATR Indicator
The Tenkan-ATR Indicator is a powerful and innovative indicator for Traders. SALE OFF!!!
DMG Indicator POSIZIONE APERTE e Prezzi ,SU GRAFICO
Visualizzazione delle Posizioni dei simboli attivi su grafico
Indicator
Indices
Stocks
Commodities
+2
DayOfWeek - FXMaster
Day of Week Indicator for cTrader
Indicator
RSI
Breakout
Supertrend
Swing Levels
🔍 Automatically detect support and resistance levels based on "swings" or pivots
trPDHLC
this indicator shows previous day high low and closed with precise manner.
Indicator
NAS100
NZDUSD
XAUUSD
+11
SessionOne
Session One is a tool for marking from to, useful if you've set the hours you want to trade
LT_FairValueGap
Detects valid Fair Value Gaps from strong 3-bar patterns. Keep drawing unfilled gaps until price fills them.
Indicator
NAS100
NZDUSD
Breakout
+12
Samurai Breakout Pro II
⚔️Full breakout trading workstation: session box, EP/TP/SL levels, on-chart ✓/✗ outcomes, pro-level analytics and more⚔️
Indicator
RSI
Breakout
XAUUSD
+5
Shielded Trend
Buy/Sell signals filtering noise, color-coded trends & strength shield 🛡️. Trade only with POWER ⚡
Indicator
Signal
MACD
MacD Custom Indicator Multi Time Frame
MacD Custom Indicator-Multiple Time Frame+All Available Options!
Indicator
ZigZag
RSI
FVG
+4
Ten Thousand Functions Bands Cloud(First Edition)
A metric that can set 1 to 3 groups of Bollinger Bands
Indicator
Breakout
Stocks
Commodities
+1
Advanced Donchian Zones
MTF Donchian: Identify trend breakouts & key zones with precision. Perfect for swing & day traders seeking accuracy!
PriceLevels
Displays the previous day's, last week's, and last month's highest and lowest price levels on your chart.