
LT_Ind_VWAP
Indicator
2 purchases
Version 1.0, Oct 2025
Windows, Mac
4.5
Reviews: 2
Description
Note: Tested on cTrader Windows only.
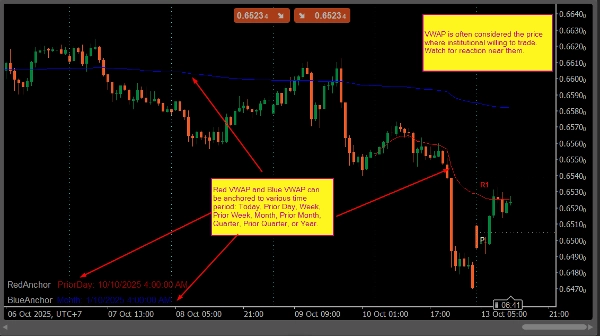
LT_Ind_VWAP is a practical anchored VWAP indicator for cTrader.
It plots two VWAP lines (Red and Blue) that can each be anchored to a selected period, such as Today, Prior Day, Week, Prior Week, Month, Prior Month, Quarter, Prior Quarter, or Year.
The indicator automatically recalculates when a new day begins and shows the active anchor and date directly on the chart. It’s designed for traders who use VWAP levels to track fair value, trend bias, or mean-reversion areas.
Main Features
- Two VWAP lines with independent anchors
- Supported anchors: Today, Prior Day, Week, Prior Week, Month, Prior Month, Quarter, Prior Quarter, Year
- Auto recalculation on session change
- Anchor info displayed on chart
- Simple setup, minimal resource use
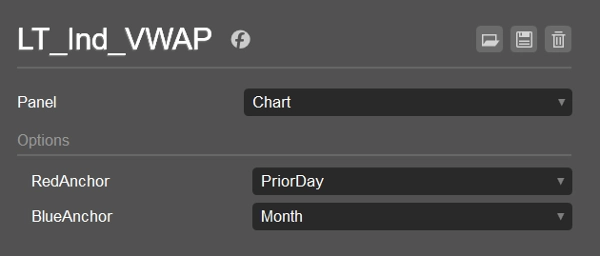
Default Settings
- Red VWAP: Prior Day
- Blue VWAP: Month
Use Cases
- Compare intraday price with prior-day VWAP
- Monitor monthly or quarterly VWAP for swing bias
- Find confluence between short- and long-term VWAP levels
Summary
AI summary
LT_Ind_VWAP is an anchored VWAP (Volume Weighted Average Price) indicator designed for the cTrader platform (Windows version). It displays two independent VWAP lines—red and blue—each anchored to selectable time periods including Today, Prior Day, Week, Prior Week, Month, Prior Month, Quarter, Prior Quarter, or Year. The indicator automatically recalculates at the start of a new trading session and shows the active anchor and date on the chart for easy reference. Its primary use cases include comparing intraday prices with prior-day VWAP, monitoring monthly or quarterly VWAP for swing trading bias, and identifying confluence between short- and long-term VWAP levels. The default settings anchor the red VWAP to the prior day and the blue VWAP to the current month. LT_Ind_VWAP offers a simple setup with minimal resource consumption, making it suitable for traders who rely on VWAP levels to assess fair value, trend direction, or mean-reversion zones across various markets such as Forex, indices, commodities, cryptocurrencies, and stocks.
Indicator profile
Customer reviews
4.5
Reviews: 2
5 | 50 % | |
4 | 50 % | |
3 | 0 % | |
2 | 0 % | |
1 | 0 % |
Customer reviews
October 26, 2025
Discussion
FAQ
Prop
Forex
Indices
Commodities
Crypto
Stocks
VWAP
Products available through cTrader Store, including trading bots, indicators and plugins, are provided by third-party developers and made available for informational and technical access purposes only. cTrader Store is not a broker and does not provide investment advice, personal recommendations or any guarantee of future performance.


Price
Since 25/09/2024
34
Sales