
LT_Ind_SRZones
Indicator
3 purchases
Version 1.0, Oct 2025
Windows, Mac
4.6
Reviews: 3
Description
Note: Tested on cTrader Windows only.
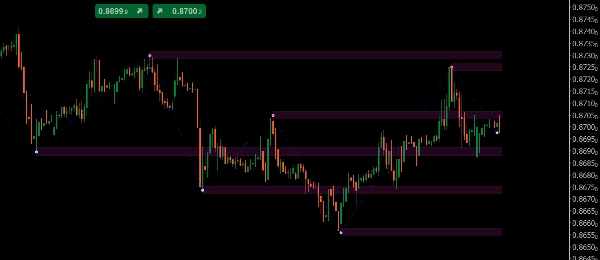
LT_Ind_SRZones detects swing highs/lows, merges nearby swings into Support/Resistance zones, and keeps your chart focused on the most relevant levels around current price.
What it draws
- Zones: shaded bands built from merged swings
- Swing High/Low points
- ZigZag path for quick structure reading
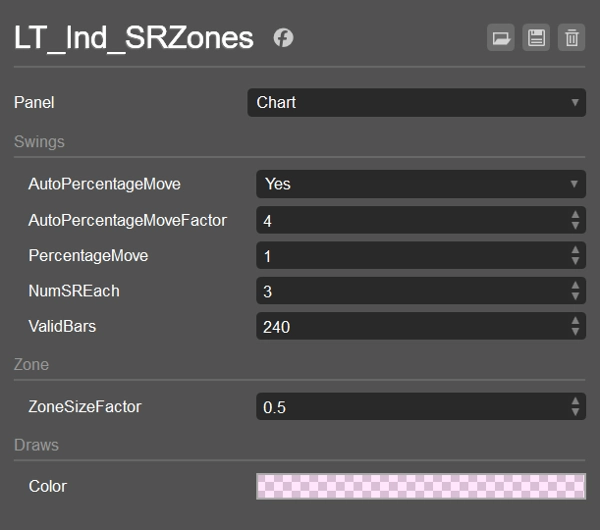
Key Controls
- AutoPercentageMove (bool) + AutoPercentageMoveFactor (double)
Auto-tunes swing sensitivity. Turn off to use PercentageMove manually. - PercentageMove (double)
Minimum move (as %) to form a swing when Auto is off. - ZoneSizeFactor (double)
Zone height =ZoneSizeFactor × ATR. - NumSREach (int)
How many top zones to keep above and below current price. - ValidBars (int)
Ignore swings older than this many bars. - Color / Show styles
Zone fill color (with alpha), Swing/ZZ styles.
Ordering & Filter Logic (how zones are chosen)
- Collect swings from most recent backwards, only permanent ones and not older than
ValidBars. - Count swings above and below current price (including those whose value falls inside half a zone). Stop when both sides reach
NumSREach. - Fallback: if a side has no eligible swing, add one older swing for that side.
- Merge: for each entitled swing, either merge into an existing zone (
CanMerge) or create a new zone. - Rank & pick:
- Above price: sort zones by (High − price) ascending, then by MostRecentIndex descending; take
NumSREach. - Below price: sort by (price − Low) ascending, then by MostRecentIndex descending; take
NumSREach. - Union the two lists → final zones shown.
- Above price: sort zones by (High − price) ascending, then by MostRecentIndex descending; take
This keeps the display clean, nearby, and recent, while still handling edge cases.
Defaults
- AutoPercentageMove = true, AutoPercentageMoveFactor = 4
- PercentageMove = 1.0 (used when Auto = false)
- NumSREach = 1
- ValidBars = 240
- ZoneSizeFactor = 0.5 (zone height = 0.5 × ATR)
- Zone Color = #21FF33E0 (semi-transparent)
- Swing High = #FFFF999A, Swing Low = #FF99DFF9, ZigZag = Blue (Dots)
Use Cases
- Mark nearby S/R zones for entries, partials, or stops
- Watch zone flips (support → resistance and vice versa)
- Combine with VWAP/Pivots for confluence
Works on any symbol and timeframe. Lightweight and ready for live trading or backtests.
Summary
AI summary
LT_Ind_SRZones is an indicator designed for cTrader Windows that automatically identifies and displays support and resistance zones derived from swing highs and lows. It detects swing points, merges nearby swings into shaded support/resistance zones, and highlights the most relevant levels around the current price to maintain a clear chart view. The indicator also plots swing high/low points and a ZigZag path for quick structural analysis.
Key adjustable parameters include automatic or manual swing sensitivity settings, zone size based on a factor of the Average True Range (ATR), the number of top zones to display above and below the current price, and the maximum age of swings considered. The indicator filters and ranks zones by proximity and recency, ensuring the display focuses on recent and nearby levels.
LT_Ind_SRZones works on any symbol and timeframe, supporting markets such as Forex, indices, commodities, cryptocurrencies, and stocks. It is suitable for live trading and backtesting. Typical use cases include marking nearby support/resistance zones for trade entries, stops, or partial exits, monitoring zone flips (support to resistance and vice versa), and combining with other indicators like VWAP or pivots for confluence.
Indicator profile
Customer reviews
4.6
Reviews: 3
5 | 67 % | |
4 | 33 % | |
3 | 0 % | |
2 | 0 % | |
1 | 0 % |
Customer reviews
October 22, 2025
October 15, 2025
the routine feels easier to keep, but the chart still needs a human read.
Discussion
FAQ
Prop
Forex
Indices
Commodities
Crypto
Stocks
Products available through cTrader Store, including trading bots, indicators and plugins, are provided by third-party developers and made available for informational and technical access purposes only. cTrader Store is not a broker and does not provide investment advice, personal recommendations or any guarantee of future performance.


!["[Stellar Strategies] Market Session Ultimate" logo](https://cdn.ctrader.com/image/webp/61ffd537-0125-4246-9e72-42eca1791d64_28232)


Price
Since 25/09/2024
34
Sales