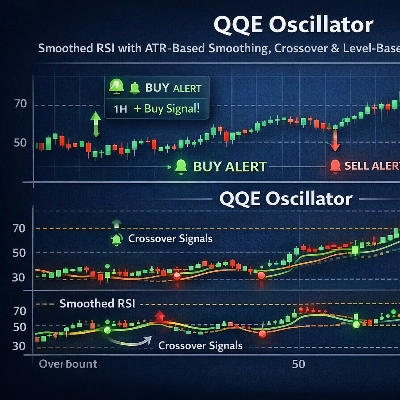
"Shielded Trend" logo
Indicator
230 downloads
Version 1.0, Apr 2025
Windows, Mac
"Shielded Trend" uploaded image
Since 03/10/2024
151
Sales
34.94K
Free installs

Pinescriptlabs Store indicators:                        🤖Pinescriptlabs  Store cBots:


 ICT Power of 3

 BOS & CHOCH

SmartTrend Support &
Resistance Lines
         Gold & BTC BreakoutSession Pivots(new)YieldShield" 🛡️

Fair Value Gap Sessions                      
       

ZigZag

RSI Trend Trigger

Channel Breakout System

Supertrend

Market Imbalance

Adaptive Trend Channel 

Dynamic Market Structure
Analysis of Turning Points

Order Block

Fibonacci Linear
Regression Multi-timeframe

Volume POC Heatmap

Dynamic RSI

Momentum Fair Value Gap

Market Flow Projection

Dynamic Trend Gradient

Multi-Level Candle Bias
Tracker

Zig-Zag Extremity Tracker

Reactive Moving Average

Auto-Trend Channel

Auto Support and
Resistance Trend Lines

All Support and
Resistance Levels

Leverage Liquidation Map

Zones Supply Demand

Dynamic Range Momentum


The ShieldedTrend indicator is based on a smart combination of two widely used trading methodologies: Heikin-Ashi candles 📊 and exponential moving averages (EMA) 📈. Here’s the step-by-step logic:

1️⃣ Base: Modified Heikin-Ashi Candles

Heikin-Ashi candles are a smoothed version of traditional candles, designed to filter out market noise. Their original calculation uses price averages, but ShieldedTrend modifies them in two key ways:

  • Heikin-Ashi Close:
    Calculated as the average of the 4 main prices of the real candle:
    (Open + High + Low + Close) / 4 🔄.
  • Heikin-Ashi Open:
    Not taken directly from the real price, but rather the average of the previous Heikin-Ashi candle’s open and close.

This creates a natural "smoothing" effect that removes sharp fluctuations, making trends clearer.

2️⃣ Smoothing with EMA

ShieldedTrend applies an exponential moving average (EMA) to both components of the Heikin-Ashi candles:

  • Smoothed Open Line:
    The EMA applied to the Heikin-Ashi open.
  • Smoothed Close Line:
    The EMA applied to the Heikin-Ashi close.

The EMA gives more weight to recent data, allowing the indicator to react quickly to trend changes while maintaining smoothness.

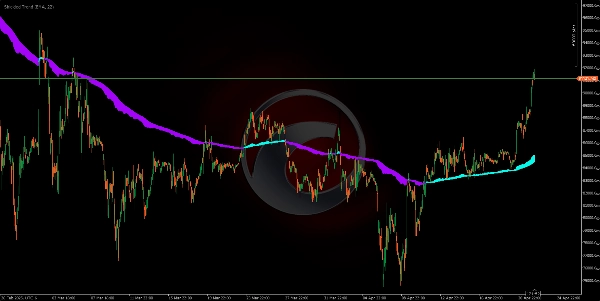
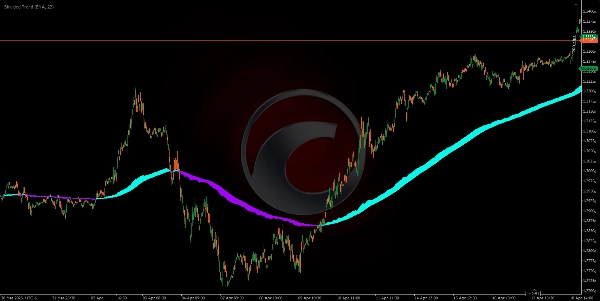
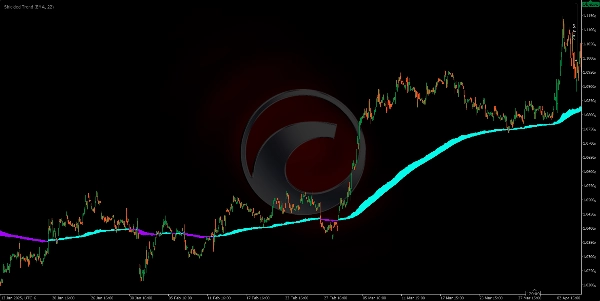
3️⃣ The "Protection Zone" (Shield) 🛡️

The colored area between the two lines (smoothed open and close) acts as a buffer or confirmation zone:

  • Zone Width:
    Depends on the difference between the two lines.
    • Wide area = Strong trend (lines are far apart) 💪.
    • Narrow area = Indecision or weak trend 🤔.

4️⃣ Integrated Trading Logic

  • Trend Signal:
    A color change indicates a potential reversal (e.g., cyan to purple = possible start of a downtrend) 🔵🟣.
  • Trend Strength:
    The width of the colored area acts as a confidence filter:
    • Only trade if the area is wide enough (avoids choppy markets) ✅.
  • Protection Against False Moves:
    If the area suddenly narrows, it suggests the current trend may be losing momentum—even if the color hasn’t changed yet ⚠.

🌟 Why Does It Work?

  • Heikin-Ashi + EMA: Smoothes price twice (candles + moving average), filtering out 90% of noise 🎯.
  • Protection Zone: Avoids trading in unclear markets, reducing failed trades 📉➡️📈.
  • Visual Approach: The combination of color and area makes it easy even for beginner traders to spot patterns quickly ⚡.
Indicator profile
0.0
Reviews: 0
Customer reviews
No reviews for this product yet. Already tried it? Be the first to tell others!
BTCUSD
Signal
Breakout
Supertrend
Commodities
RSI
Crypto
XAUUSD
Products available through cTrader Store, including trading bots, indicators and plugins, are provided by third-party developers and made available for informational and technical access purposes only. cTrader Store is not a broker and does not provide investment advice, personal recommendations or any guarantee of future performance.

More from this author

Indicator
ATR
RSI
+7
ZigZag filters noise, spots trends, patterns, pivots, aiding analysis, trade management, and confirmations. 📉📈
Indicator
ATR
RSI
+7
Identify bullish and bearish Order Blocks to spot key support/resistance levels and potential trend reversals! 📈🔄
Indicator
ATR
RSI
+7
📊 Shows volume by price levels, highlights POC, and key zones. Identifies dynamic support/resistance and imbalances.
Indicator
ATR
RSI
+6
Market structural patterns , specifically the concepts of Change of Character (ChoCH) 🔄 and Break of Structure (BoS) 💥
Indicator
ATR
RSI
+6
Adaptive trend channel using linear regression and Pearson correlation for dynamic support, resistance, and trends.
Indicator
RSI
Breakout
+1
"Identify key market zones and visualize support/resistance from multiple timeframes on a single chart.
Indicator
ATR
RSI
+7
identify and highlight temporary market inefficiencies known as "fair value gaps" 🚨 within specific trading Sessions.
Indicator
ATR
RSI
+6
💹 Define a price channel 📈 and determine trend direction (bullish 🟢 or bearish 🔴).
Indicator
ATR
RSI
+6
📊Zones Supply & Demand: Identifies key price levels with high volume concentration, marking Supply/Demand Zones & Marke
Indicator
RSI
BTCUSD
+5
Identify market structure effortlessly with swing highs, lows, CHoCH, and BOS levels for smart trading decisions! 📊🔍"
Indicator
ATR
RSI
+8
Detects bullish and bearish divergences
Indicator
Advanced price action tool that combines multiple technical analysis concepts

You may also like

Indicator
ATR
Prop
Outside Candle Detector: Highlights major candles/zones with ATR filter & pattern labels. By Avydel Talbo, prop trader.
Indicator
📊 Smart Floating Risk Pro – Advanced Risk Management for cTrader
Indicator
Supertrend
smart System
Indicator
Parabolic SAR Alert - Trend reversal alerts with smart signals & custom alerts.
Indicator
SMC
Prop
+13
Tracks virgin levels. Lines vanish only after a candle closes beyond the high/low on your chosen timeframe.
Indicator
Forex
BTCUSD
+5
INDICATOR,LIQUIDITY POOLS,ACCURATE SIGNAL, NO DELAY,80% PROBABILITY
Indicator
ZigZag
Indices
+2
Auto Trendlines, Fibonacci, Pitchfork and Patterns from non‑repainting pivots. One‑click Presets, targeted Alerts, and a
Indicator
ATR
MACD
+15
MACD Advanced -- It combines the standard MACD logic with a rich set of visual tools
Indicator
Prop
Forex
+12
A clean, real-time risk HUD designed to prevent prop firm account failure and protect your challenge account.
Indicator
EMA
SMA
+2
Exhaustion Hunter by BeyondTrading — When price hits the limit, the reversal is next.
Indicator
Signal
🔹 Trend-Reversal-Indicator for cTrader 🔹 The ultimate Renko chart tool!
Indicator
ADX
ATR
+5
Signal Quality Score - 0-100 filter combining RSI, Volume, ATR, Trend Strength & Alignment. Works on ANY chart type.
Indicator
Support & Resistance
Multi-Timeframe exhaustion indicator. Detects trend loss with Doji filter & dynamic volatility.
"Screener" logo
Popular
4.5
(2)
$35
Indicator
AI
RSI
+7
Multi-asset screener with real-time RSI/volatility analysis, interactive dashboard, and color-coded trading signals.
Indicator
ATR
SMC
+21
MA Quant Adaptive Price Zone Oscillator identifie dynamiquement les zones de prix optimales pour les entrées et sorties.
Indicator
Grid
Forex
+4
indicator showing the Daily Open Line and instantly shading bullish and bearish zones.
Indicator
SMC
Forex
+13
MultiFrameCandles para cTrader: La Herramienta Definitiva para Dominar Cualquier Marco de Tiempo
Indicator
Inducement
Key Levels
+5
Digital Clock Overlay that displays a live, second-by-second clock and optional date directly on the trading chart.
Since 03/10/2024
151
Sales
34.94K
Free installs