Açıklama
🌟 Fibonacci Doğrusal Regresyon🌟
Fibonacci Regresyon Bantları göstergesi, regresyon çizgilerinin gücünü Fibonacci seviyeleriyle birleştiren gelişmiş bir teknik araçtır ve finansal piyasalarda trendleri, destek/direnç bölgelerini ve potansiyel dönüş noktalarını belirlemek için kullanılır. 📈 Bu gösterge, aynı anda birden fazla zaman dilimini (5m, 15m, 30m ve 4s) analiz ederek çok boyutlu bir bakış açısı sunar ve traderların örtüşme alanlarını daha hassas şekilde tespit etmelerini sağlar. ⏳
🎯 Gösterge Ne Yapar?
Gösterge, geçmiş fiyat verilerine dayalı regresyon kanalları oluşturur ve bunları Fibonacci geri çekilme seviyeleriyle entegre ederek önemli piyasa bölgelerinin kapsamlı görsel haritasını sunar. Çeşitli zaman dilimlerini analiz ederek, uzun vadeli trendlerle kısa vadeli fiyat hareketlerini harmanlayan bütünsel bir fiyat davranışı görünümü sağlar. 📊
🔍 Ana Bileşenler
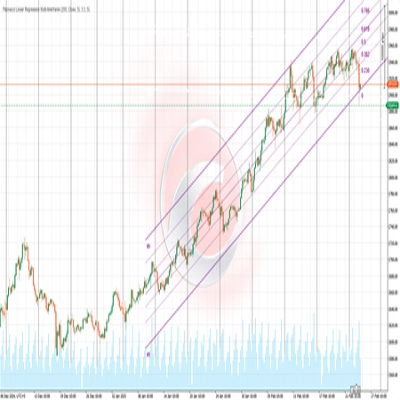
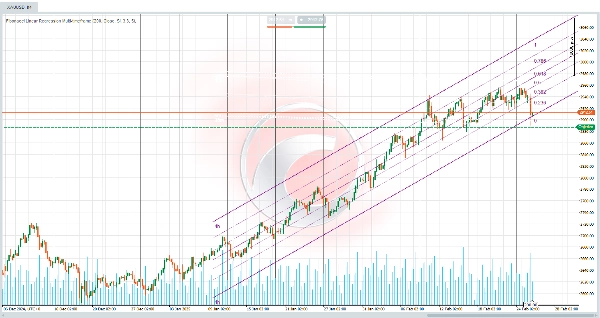
- Regresyon Kanalları: Gösterge, genel fiyat trendini göstermek için kullanıcı tarafından tanımlanan bir dönem boyunca (varsayılan: 200 bar) doğrusal regresyon çizgileri hesaplar. 📉📈
- Sapma Bantları: Üst ve alt bantlar, merkezi regresyon çizgisi etrafında çizilir ve fiyatın istatistiksel sapmalarını temsil eder; Bollinger Bantlarına benzer ancak doğrusal regresyona dayanır. 📐
- Fibonacci Seviyeleri: Klasik Fibonacci seviyeleri (0, 0.236, 0.382, 0.5, 0.618, 0.786 ve 1) kanal içinde çizilir ve potansiyel sıçrama veya devam noktaları sunar. 🔢
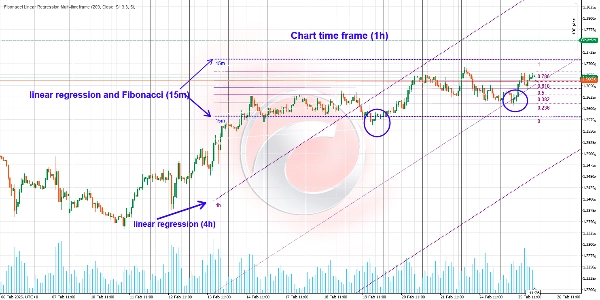
- Çoklu Zaman Dilimi Analizi: 5 dakikalık, 15 dakikalık, 30 dakikalık ve 4 saatlik zaman dilimlerinin eşzamanlı analizi, her biri farklı renklerle temsil edilir ve birden fazla zaman diliminin hizalandığı bölgeleri belirlemeye yardımcı olur. 🎨
🔄 Çok Boyutlu Piyasa Analizi
Bu strateji, piyasayı birden fazla açıdan görmenizi sağlar, uzun vadeli trendleri kısa vadeli fiyat hareketleriyle entegre eder. Bu yaklaşım şunları mümkün kılar:
- Piyasa gelişirken işlemleri dinamik olarak ayarlamak. 🔄
- Gerektiğinde zaman dilimleri arasında geçiş yapmak. ⏱️
- Ana trend içindeki büyük hareketleri yakalamak. 🚀
- Giriş ve çıkış noktalarını optimize etmek için küçük dalgalanmalardan faydalanmak. 🎯
🔄 Zaman Dilimleri Arasındaki Etkileşim
4 Saatlik Zaman Dilimi ve Regresyon Kanalı
- Hakim trende dair içgörü sağlar. 💪
- Genel piyasa yönünü değerlendirmek için sağlam bir temel sunar.
- Bu bağlamda, karmaşayı önlemek için Fibonacci seviyeleri devre dışı bırakılabilir.
- Odak, hakim trendi gösteren regresyon kanalında kalır.
Daha Düşük Zaman Dilimleri Regresyon ve Fibonacci ile
- Daha kısa zaman dilimlerinde (5m, 15m veya 30m) regresyon çizgileri ve Fibonacci seviyelerini etkinleştirin.
- Daha geniş trend bağlamında daha hassas sinyaller elde edin.
- Fibonacci seviyeleri, daha büyük zaman diliminde potansiyel giriş ve çıkış noktalarını belirlemeye yardımcı olur.
📊 Sonuçları Nasıl Yorumlamalı?
Trendleri Belirleme
- Merkezi regresyon çizgisinin yönü hakim trendi gösterir (boğa, ayı veya yatay). 📈📉➡️
- Çizginin eğimi trend gücünü belirtir—daha dik eğimler daha güçlü trendleri gösterir. 🔍
- Farklı zaman dilimlerinden regresyon çizgilerinin aynı yönde yakınsaması güçlü ve güvenilir bir trend anlamına gelir.
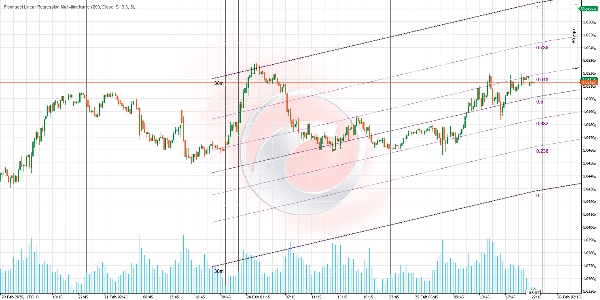
Destek ve Direnç Bölgeleri
- Üst ve alt bantlar dinamik destek ve direnç bölgeleri olarak işlev görür. 🛡️
- Kanal içindeki Fibonacci seviyeleri ek destek/direnç sağlar, özellikle 0.618 ve 0.382 seviyelerinde.
- Farklı zaman dilimlerinden Fibonacci seviyeleri hizalandığında, yüksek olasılıklı örtüşme bölgeleri oluştururlar.
🌐 Örtüşme Bölgelerini Belirleme
Örtüşme bölgeleri, regresyon çizgileri ve Fibonacci seviyelerinin üst üste geldiği yerlerde oluşur. Bu alanlar önemli fiyat tepkilerinin muhtemel noktalarını temsil eder:
- Bir Fibonacci geri çekilmesi, regresyon kanalının üst veya alt kenarıyla hizalandığında güçlü bir destek veya direnç noktası olarak işlev görür.
- Farklı zaman dilimlerinden regresyon çizgileri kesiştiğinde veya yakınsadığında.
- Birden fazla zaman diliminden Fibonacci seviyeleri belirli bir bölgede çakıştığında.
- Fiyat, regresyon kanal çizgisiyle örtüşen bir Fibonacci seviyesinde tam olarak sıçradığında.
🔄 Dönüş Bölgelerini Belirleme
Fiyat, daha küçük bir zaman diliminde regresyon kanalını kırar ve önemli bir Fibonacci seviyesine yaklaşırsa, bu olası bir dönüş sinyali olabilir. Ek dönüş işaretleri şunlardır:
- Aşırı genişleme: Fiyat üst/alt bandı aşar veya ona ulaşır, özellikle birden fazla zaman diliminde Fibonacci seviyeleriyle hizalandığında.
- Momentum göstergeleriyle uyumsuzluk: Bu göstergeyi RSI, MACD veya diğerleriyle birlikte kullanmak uyumsuzluk tespitini artırabilir.
- Merkezi Çizgi Kırılması: Merkezi regresyon çizgisinin aşılması, özellikle birden fazla zaman diliminde eşzamanlı gerçekleşirse fiyat dinamiklerinde değişiklik sinyali olabilir.
🧩 Senaryo Çeşitliliği
Birden fazla zaman diliminde regresyon kanalları ve Fibonacci seviyelerinin çeşitli kombinasyonlarını kullanmak, farklı ticaret senaryoları yaratabilir:
- 4 saatlik zaman diliminde uzun pozisyonu korurken, aynı anda daha küçük zaman dilimlerinde Fibonacci sıçramalarından faydalanmak.
- Ana trendi 4 saatlik regresyon kanalıyla belirleyip, daha küçük zaman dilimlerinde Fibonacci seviyelerine geri çekilmelerde optimal girişler bulmak.
- Birden fazla zaman dilimindeki örtüşmeleri kullanarak yüksek olasılıklı giriş ve çıkış noktalarını onaylamak.
📈 Ticaret Stratejileri
Dönüş Stratejisi
- Farklı zaman dilimlerinden birden fazla Fibonacci seviyesi ve bandın örtüştüğü bölgeleri belirleyin.
- Fiyat onayı için bekleyin (mum formasyonları, uyumsuzluklar vb.).
- Önceki trende karşı sıkı bir stop loss ile giriş yapın.
- Hedefleri bir sonraki Fibonacci seviyesi veya merkezi regresyon çizgisine koyun.
Devam Stratejisi
- Merkezi çizgiye veya önemli Fibonacci seviyelerine (0.382 veya 0.618) geri çekilmeleri arayın.
- Genel trendin birden fazla zaman diliminde sağlam kaldığını doğrulayın.
- Fiyat bu seviyelerden sıçradığında trend yönünde giriş yapın.
- İlgili Fibonacci seviyesinin altına/üstüne stop loss koyun.
Fibonacci Doğrusal Regresyon göstergesinden faydalanarak, traderlar piyasa dinamiklerine daha derinlemesine hakim olabilir ve daha bilinçli ticaret kararları alabilir. Dikkatli olun ve akıllıca işlem yapın! 💻📈
Ctrader Store göstergeleri:
Dynamic Market Structure
Analysis of Turning Points
Fibonacci Linear
Regression Multi-timeframe
Multi-Level Candle Bias
Tracker
Auto Support and
Resistance Trend Lines
Özet
Müşteri değerlendirmeleri
5 | 100 % | |
4 | 0 % | |
3 | 0 % | |
2 | 0 % | |
1 | 0 % |