Pinescriptlabs Store indicators: Pinescriptlabs Store cBots : (cBot) Gold & BTC BreakoutSession Pivots(new)
Advanced Market Structure: Bos, Choch, SwinLevels, Order Blocks, Market Structure & Liquidity Finder (New)
ZigZag Price Liquidity Projection
Trailing Smart Algorithm (new)
Prediction Based on Linreg & ATR
SmartTrend Support &
Resistance
Lines
Dynamic
Market Structure
Analysis
of
Turning
Points
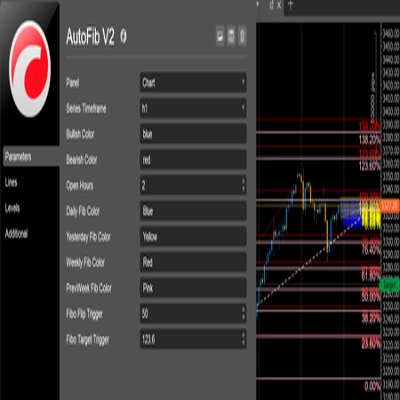
Fibonacci
Linear
Regression
Multi-timeframe
Auto
Support and
Resistance
Trend
Lines
All
Support and
Resistance
Levels
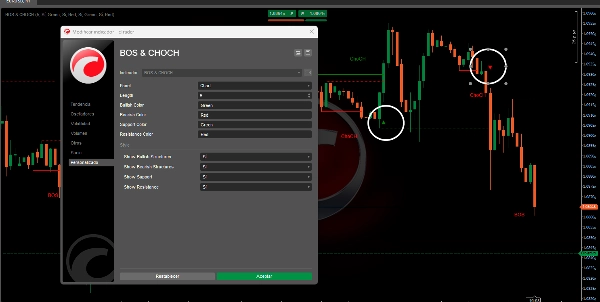
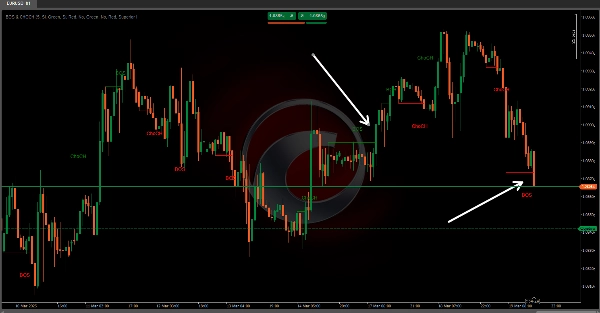
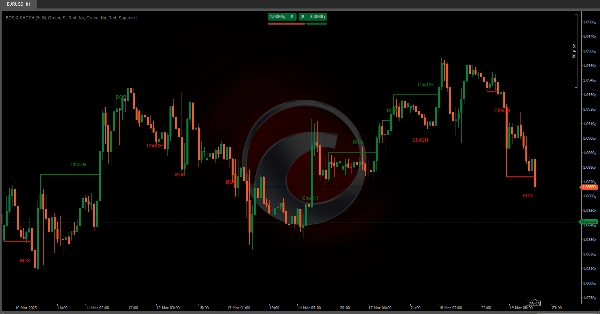
The algorithm is designed to identify market structural patterns , specifically the concepts of Change of Character (ChoCH) 🔄 and Break of Structure (BoS) 💥. Below, I will explain in detail what this algorithm does, its purpose, and how it identifies these two concepts.
What Does the Algorithm Do?
The algorithm uses fractals (local highs and lows) to determine whether the price has changed its behavior or broken a previously established structure. Below are the main functionalities:
Fractal Detection 📊
- An bullish fractal occurs when there is a local high where the candles on both sides are lower. 📈
- A bearish fractal occurs when there is a local low where the candles on both sides are higher. 📉
- These fractals act as reference points for identifying changes in market structure.
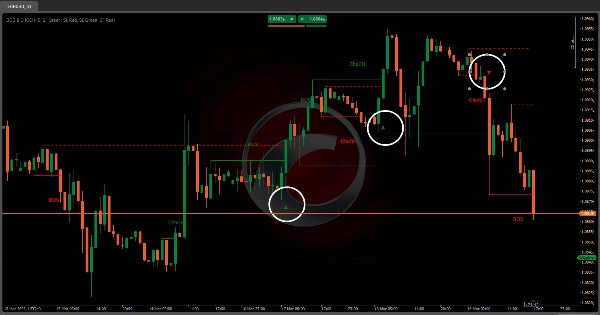
Identification of ChoCH (Change of Character) 🔄
- A bullish ChoCH occurs when the price surpasses a bullish fractal without forming a complete bearish structure beforehand.
- A bearish ChoCH occurs when the price falls below a bearish fractal without forming a complete bullish structure beforehand.
- This indicates that the market has changed its character (from trend to consolidation or vice versa).
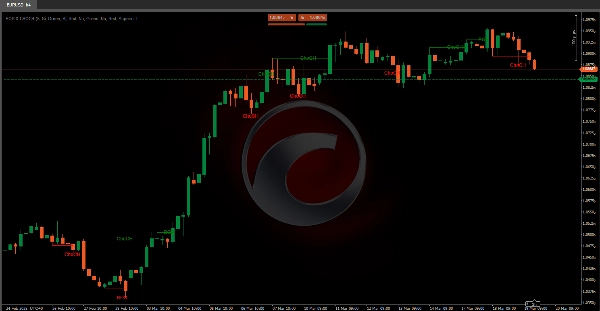
Identification of BoS (Break of Structure) 💥
- A bullish BoS occurs when the price surpasses a bullish fractal after forming a complete bearish structure beforehand.
- A bearish BoS occurs when the price falls below a bearish fractal after forming a complete bullish structure beforehand.
- This indicates that the market has broken a previously established structure, which can be an important entry or exit point.
Visualization of Support and Resistance 🛡️
- The algorithm can draw support and resistance lines based on the detected fractals.
- It also checks if these lines are broken, marking the breakout points with visual icons.
This algorithm provides traders with valuable insights into market behavior by clearly identifying key structural changes and potential breakout opportunities. By leveraging ChoCH 🔄 and BoS 💥 signals, traders can make more informed decisions about entries, exits, and overall market dynamics.
5 | 100 % | |
4 | 0 % | |
3 | 0 % | |
2 | 0 % | |
1 | 0 % |


!["[Stellar Strategies] Wave Trend Pro" logo](https://cdn.ctrader.com/image/webp/5f226fbb-245a-41cd-9cdd-b018257d5e6d_28617)