
Beschreibung
Pinescriptlabs Store Indikatoren: Pinescriptlabs Store cBots : (cBot) Gold & BTC BreakoutSession Pivots(neu)
PRICE ACTION (Neu)
Trailing Smart Algorithm (neu)
Vorhersage basierend auf Linreg & ATR
SmartTrend Unterstützung &
Widerstand
Linien
Dynamische
Marktstruktur
Analyse
von
Wendepunkten
Punkten
Fibonacci
Lineare
Regression
Multi-Zeitrahmen
Multi-Level
Kerzen-Bias
Tracker
Reaktive gleitende Durchschnitt
Auto
Unterstützung und
Widerstand
Trend
Linien
Alle
Unterstützungs- und
Widerstandsniveaus
Levels
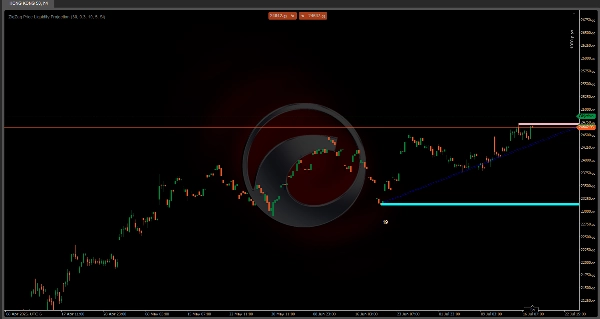
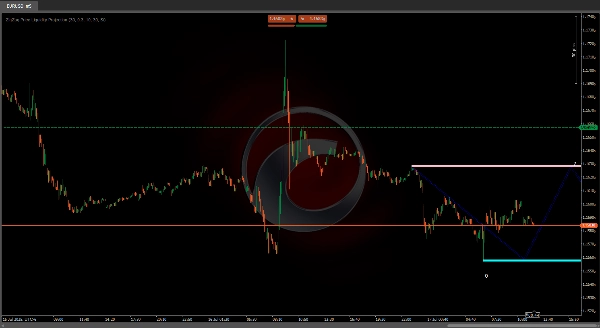
📊 ZigZag Preisliquiditäts-Projektionsindikator
"Sehen Sie, wo sich der Markt drehen könnte, bevor es passiert!" 🔮
Dieser Indikator identifiziert wichtige Unterstützungs-/Widerstandsniveaus 🛑 und sagt Liquiditätszonen voraus 💧 in Ihrem Chart mithilfe von:
- 🔍 Pivot-Punkte: Erkennt signifikante Hoch- und Tiefpunkte
- 📈 ATR-Volatilität: Misst Preisschwankungen für präzise Abstimmung
- 💦 Liquiditätsprojektionen: Erwartet Bereiche mit hoher Aktivität (Kauf-/Verkaufscluster) durch Zigzag-Muster
🎯 Zweck: Sagt Preisreaktionszonen voraus (Abpraller/Ausbrüche/Konsolidierungen) zur Verbesserung von Ein- und Ausstiegsentscheidungen
✨ Der Zigzag-Vorteil
Diese verbundenen Linien fungieren wie eine Schatzkarte 🗺️ und zeigen:
1️⃣ Zukünftige Preiswege innerhalb definierter Bereiche
2️⃣ Potenzielle Umkehrzonen wo der Preis stagnieren oder umkehren könnte
3️⃣ Visuelle Referenzpunkte für die Handelsplanung
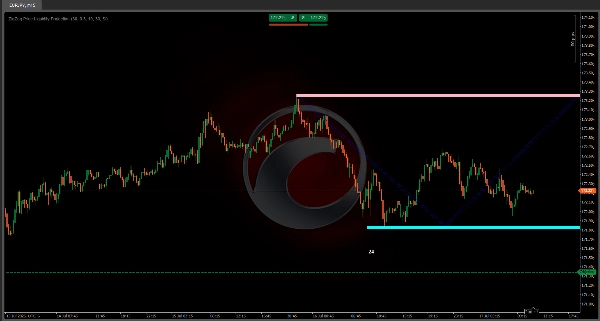
🚦 Hauptmerkmale:
- 📅 Frühwarnsystem für wichtige Niveaus
- 🎯 Projektiert zukünftige Bewegungen basierend auf Pivot-Strukturen (bullische/bärische Pfade)
- 🔢 Berührungszähler (z.B. "24" = 24 historische Tests auf diesem Niveau)
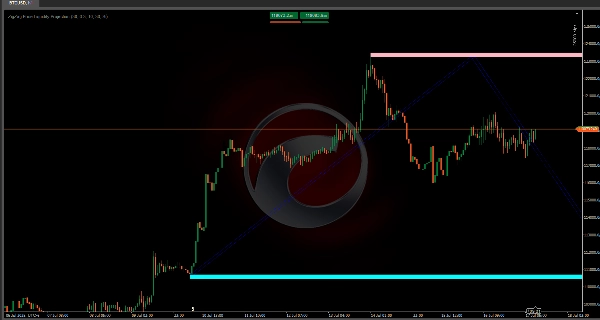
⚙️ Empfohlene Einstellungen
EinstellungWertWirkung
ATR Periode
30
🎚️ Volatilitätsempfindlichkeit
Pivot Periode
30
🔍 Pivot-Bedeutungsbereich
⏳ Beste Zeitrahmen: 15min - 4hr Charts ⏱️
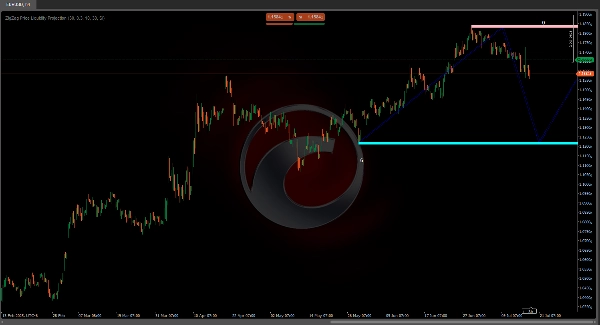
💡 Profi-Tipp:
"Kombinieren Sie mit Kerzenmustern 🕯️ zur Bestätigung! Der Zigzag zeigt WO der Preis hingehen könnte, Kerzen zeigen WANN es passiert."
🎯 Abschließende Erkenntnis:
Ein leistungsstarkes All-in-One-Visual-Tool zum Erkennen von:
✅ Liquiditätszonen 💦
✅ Kritischen Niveaus 🎯
✅ Zukünftigen Preiswegen 🚀
Perfekt für Intraday-Trader, die Bewegungen antizipieren wollen, anstatt ihnen hinterherzulaufen! 🏃💨


