Description
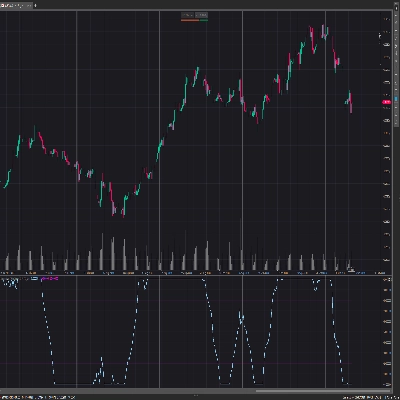
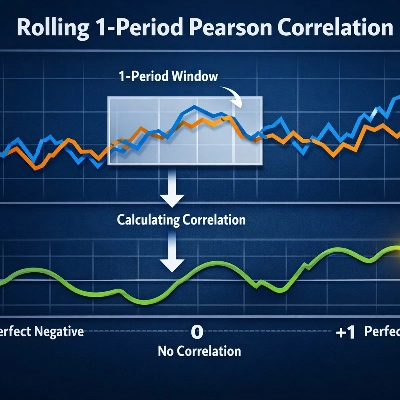
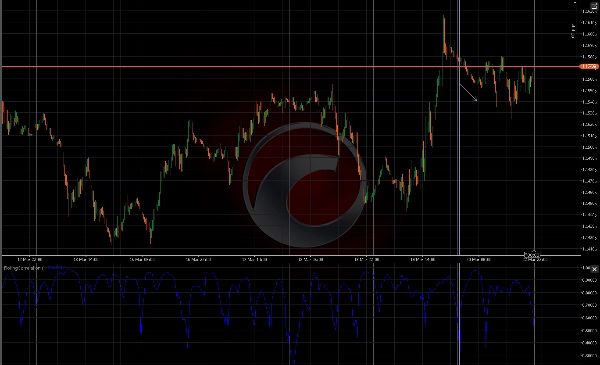
RollingCorrelation computes the rolling Pearson correlation between each close price and its 1-bar lag over a configurable window. The indicator returns values in the range [-1, 1], where values near +1 indicate strong positive autocorrelation (trend continuation), values near -1 indicate strong negative autocorrelation (oscillatory or reversal behavior), and values near 0 indicate little or no linear autocorrelation.
How it works For each bar it computes the Pearson correlation coefficient between the series of close prices and the same series shifted by one bar across the specified Period window (default 20). The implementation uses the standard covariance / variance formula to produce a single correlation value per bar.
Inputs
- Period (int, default 20): number of bars in the rolling window. The indicator needs at least Period+1 bars to compute the first value.
Output
- Correlation (line): rolling correlation value for each bar, range [-1, 1].
Interpretation & practical use
- Near +1: price shows strong persistence — recent moves likely to continue (useful for trend-following signals).
- Near -1: strong negative autocorrelation — price often reverses from one bar to the next (useful for mean-reversion tactics).
- Near 0: no consistent linear relationship at lag 1 — price movement appears random over the window.
- Typical signal patterns: threshold crossings (e.g., >0.6 or <−0.6), sustained increases/decreases in correlation, divergence between price and correlation, or filtering entries from other systems (require correlation > 0.5 for trend entries, or < −0.5 for reversal setups).
Trading ideas
- Combine with volatility filters (ATR) to avoid signals during low-volatility noise.
- Use alongside trend indicators (moving averages, MACD) to confirm direction when correlation is positive.
- Use as a short-term mean-reversion trigger when correlation is strongly negative and price is at a support/resistance level or extreme Bollinger band.
- Short timeframes (e.g., M1–M15) & shorter periods can be used for scalping; longer periods/timeframes for swing confirmation.
Recommended settings
- Default Period = 20 works well as a starting point.
- Short-term: Period 8–14 (scalping / intraday).
- Medium-term: Period 20–50 (swing / trend confirmation).
- Avoid setting Period too large on very noisy symbols or very small on very slow-moving instruments.
Limitations and notes
- Requires at least Period+1 bars to compute values.
- If the price variance inside the window is zero (flat prices), the correlation denominator may be zero — this can produce NaN/undefined results. Use sensible Period values and ensure instrument has sufficient price movement.
- This indicator measures linear lag-1 correlation only; it does not detect nonlinear relationships or multi-bar lags.
- Not a standalone trading system — best used as a filter or confirmation tool in a strategy.
Suggested examples to include in gallery
- EURUSD H1 with Period=20 showing strong correlation during a trending phase.
- BTCUSD 1H showing oscillatory behavior and negative correlation periods.
- XAUUSD 15m showing scalping use with short Period.
Summary
For each bar, the indicator computes the Pearson correlation coefficient between the series of close prices and the same series shifted by one bar within the specified period. This calculation uses standard covariance and variance formulas to generate a single correlation value per bar.
Traders can use this indicator to identify trend strength or potential reversals, applying threshold crossings or sustained changes in correlation as signals. It is useful for trend-following strategies when correlation is positive and for mean-reversion tactics when correlation is negative. The indicator can be combined with volatility filters and other trend indicators for confirmation. It supports various markets including Forex, stocks, indices, commodities, and cryptocurrencies, and is applicable across multiple timeframes from scalping (M1–M15) to swing trading.
The indicator requires at least Period+1 bars to compute values and is intended as a supplementary tool rather than a standalone trading system.