
VA Footprint
Indicator
2 purchases
Version 2.0, May 2026
Windows, Mac
4.5
Reviews: 4
Description
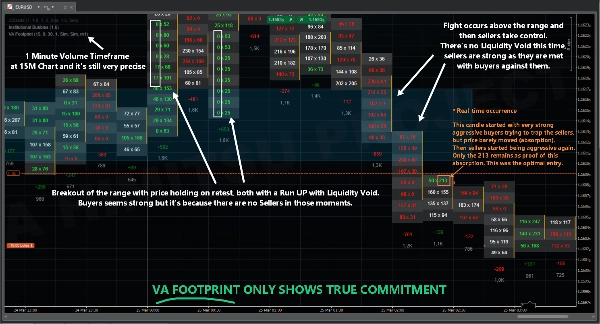
VA Footprint groups aggression by tick clusters eliminating the need for cross-referencing between levels. This structure also provides resilience against HFT spoofing (like wash trading or agressive orders mixed in the noise, intended to disguise intention at bid x ask level). Since it measures commitment over clusters of 10 ticks or more, is difficult and costly for instituitional activity to hide their footprints.
Adjustable Parameters (Relevant Settings)
- Box Duration (minutes) --> Adjust to match your chart timeframe
- Level Size (%)
- Dark Mode (true/false)
- Show Value Area (true/false)
- Volume Timeframe (10-ticks,50-ticks)
Important Considerations
- MARKET REPLAY with tick precision works, you can use that to backtest your strategy and test the indicator for longer periods.
- Increasing the Tick Level adds precision, reducing too much will reduce accuracy, at least 0.10 is recommended.
Summary
AI summary
VA Footprint is an order flow indicator that replaces traditional charts with a detailed footprint view, enabling precise market reading. It groups aggressive trading activity by clusters of ticks (typically 10 or more), reducing the need to cross-reference price levels and providing resilience against high-frequency trading spoofing tactics such as wash trading or disguised aggressive orders. This clustering approach makes it difficult for institutional activity to conceal their market footprints.
Key adjustable parameters include box duration (to align with chart timeframe), level size percentage, dark mode toggle, value area display, and volume timeframe selection (e.g., 10-tick or 50-tick clusters). The indicator supports market replay with tick precision, allowing users to backtest strategies over extended periods.
VA Footprint is applicable across multiple markets including Forex, indices, and stocks, and supports trading strategies such as scalping and smart money concepts. It provides visualizations, signals for divergences, breakouts, reversals, trend strength, volatility regimes, and level breaks, relying on tick data, bars, and volume inputs. This tool is designed to enhance market structure analysis and order flow understanding for traders.
Indicator profile
Indicator category
Order flow / DoM
Output type
Visualisation
Signals
Filter
Data requirements
Tick data
Bars only
Volume
Supported signals
Divergence
Breakout
Reversal
Trend strength
Volatility
Level break
Customer reviews
4.5
Reviews: 4
5 | 50 % | |
4 | 50 % | |
3 | 0 % | |
2 | 0 % | |
1 | 0 % |
Customer reviews
April 10, 2026
A decent setup here should survive 1 percent risk without looking messy. The first month should show both ROI and DD. The next review on it on 30 trades.
April 4, 2026
For risk management, this feels more useful as a filter than a full system. The journal should cover 76 setups and the trade context.
April 4, 2026
The stats tell the story. Tracking 1 percent risk first, compare the result with BE after 1R, and only scale if 1.5R partials still looks controlled.
March 31, 2026
Feels right for a user who wants less noise in the process. The best use is sizing and stop planning, then leaving the final filter manual. The problem appears when the tool makes weak ideas look acceptable.5R partials.
Discussion
FAQ
Prop
Forex
Scalping
Indices
SMC
Stocks
Market Structure
Products available through cTrader Store, including trading bots, indicators and plugins, are provided by third-party developers and made available for informational and technical access purposes only. cTrader Store is not a broker and does not provide investment advice, personal recommendations or any guarantee of future performance.


!["[Stellar Strategies] MARSI Signal Plotter" logo](https://cdn.ctrader.com/image/webp/7b2b8da6-8f8e-4646-8d4a-4710c516c01e_25567)

Price
Since 24/03/2026
10
Sales
62
Free installs