"cAlgoBuddy - Composite Index RSI" logo
Indicator
1 purchases
Version 1.0, Jan 2025
Windows, Mac
4.0
Reviews: 1
"cAlgoBuddy - Composite Index RSI" uploaded image
11
Sales

The best way to think of the Composite Index as it applies to the RSI is to think of the RSI as Windows 3.0 and the Composite Index as Windows 10. Constance Brown discovered that the RSI, while it does create and detect divergences, is not as accurate as it could be. It’s a bit of an oxymoron to say this but the RSI is a momentum indicator without any momentum calculation attached to it. The RSI misses a significant amount of important moves and even generates some bad moves. What Constance Brown did with the RSI was to input a momentum calculation within the RSI itself. This index removes the normalization range restrictions in RSI. This means it is not bound within the 0-100 range. 


The RSI and the Composite Index Together

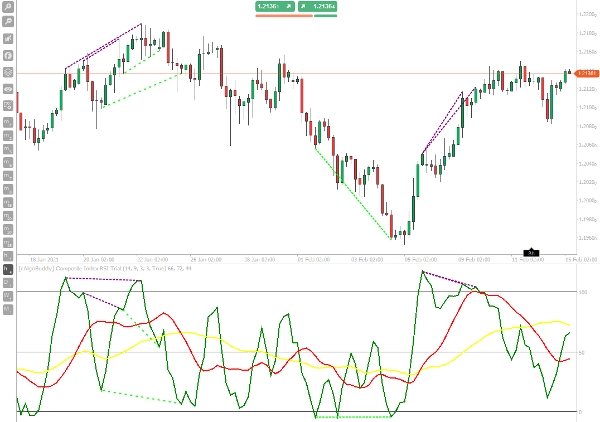
One of the strategies that Constance Brown employed with the Composite Index was to compare the Composite Index against the RSI. When we look for divergences, we look for things like bullish divergence. A bullish divergence occurs when the price creates higher highs, but the oscillator shows lower highs. When we use the RSI and the Composite Index together, we treat RSI like we would a price chart and the Composite Index is the oscillator.

The indicator has an internal normal RSI line to spot divergences, so the work has been done for you. Trade the divergence signals as you would with any other oscillator.

The main feature of the Composite Index is to represent the momentum with clear operating signals. So, when the RSI enters an overbought or oversold zone, the crossing of the Composite Index with its moving averages in the opposite direction represents a good trading signal, then, framing this symbiosis of the oscillator momentum with the action of the price on supports and resistances you get a very interesting and winning trading logic, which is also well suited to trading with cryptocurrencies.


How to Use

The Composite Index Strategy is a momentum price action strategy based on a combination of support and resistance levels with the overbought and oversold levels of the Relative Strength Index and the Composite Index. The Composite Index in this trading strategy is also the final entry timing.

Time Frame: H1+, Always use this with RSI.

Buy

  1. Price bounces on the support.
  2. Composite RSI Moving Averages are below the 50 level and fast MA (Red) is lower than slow MA (yellow).
  3. RSI creates a low and the value is near or below 30 and also Composite index has a low.
  4. We go long the moment the Composite Index crosses upward the moving averages.

Sell

  1. Price bounces on the resistance.
  2. Composite Moving Averages are above the 50 level and fast MA (Red) is higher than slow MA (yellow)
  3. RSI has a peak and the value is near or above 70 and also Composite Index has a peak.
  4. We go short when the Composite Index crosses downward the moving averages (this is the timing for entry in the market).
Indicator profile
4.0
Reviews: 1
5
0 %
4
100 %
3
0 %
2
0 %
1
0 %
Customer reviews
February 7, 2025
Forex
Signal
Breakout
Indices
EURUSD
Commodities
RSI
XAUUSD
Products available through cTrader Store, including trading bots, indicators and plugins, are provided by third-party developers and made available for informational and technical access purposes only. cTrader Store is not a broker and does not provide investment advice, personal recommendations or any guarantee of future performance.

More from this author

Indicator
Forex
Crypto
+6
The ultimate candlestick suite is here to help you detect most of the candlestick patters that exist today.
Indicator
RSI
Forex
+10
All in One indicator designed to reveal Market Sentiment.
Indicator
Forex
Crypto
+6
The cTrader Chaos Reversals indicator brings high-quality reversal signals to traders.
Indicator
Forex
EURUSD
+3
The Zone Recovery indicator is used in an advanced hedging strategy, opening traders in the opposite direction.
Indicator
ATR
Forex
+7
The purpose of the algorithm of the Boxify indicator is to try to put price action into zones, or better, boxes.
Indicator
Forex
BTCUSD
+6
This cTrader ADX Divergence indicator is used to quantify trend strength divergences in a very profitable way.

You may also like

Indicator
Forex
EURUSD
+4
Check the correlations between dozens of assets in one elegant display.
Indicator
Key Levels
Professional Market Profile
Indicator
AI
ATR
+23
Candle Timer best used for Scalper
Indicator
Prop
Forex
+15
The best filter for trading trend continuations on Renko charts.
Indicator
Inside Bar
Save time by lighting a candle to look within yourself in another temporality
Indicator
BOS
Fibonacci
+4
Automatically draws major trading sessions, killzones, and SMC daily liquidity targets directly on your cTrader charts.
Indicator
AI
Prop
+14
Professional Trading Indicator Transform Your Trading with Intelligent Signal Detection RenkoProfit
Indicator
Grid
Prop
+16
Those who are involved in trading know how important it is to take into account the previous session. With Order Block
Indicator
ATR
Market Structure
+3
Support Resistance Toolkit
Indicator
MSS
Market Structure
NY HTF Candles is a precision panel designed specifically for institutional traders
Indicator
Forex
BTCUSD
+11
Unlock trading precision with QQE! Dual QQE indicators with a Bollinger Bands zero line provide clear buy/sell signals.
Indicator
RSI
EURUSD
+2
It identifies areas of market imbalance (Fair Value Gaps or FVGs) and projects them on the chart in a smart way
Indicator
Forex
EURUSD
+5
Fimathe Indicator - Fimathe PCM - Automated Trend Channels & Levels — Ideal for live trading and backteting
Indicator
Volume
Imbalance
+5
Spot Institutional Order Flow with Proportional Volume Bubbles & Integrated Cumulative Volume Delta (CVD) Intelligence.
Indicator
Prop
Forex
+4
Personal trade tracker for a single symbol. Clear net profit summary — FreshNet, ManageNet, DayNet, WTDNet, MTDNet.
Indicator
Forex
Signal
+4
Gann Pivot Vision is an innovative analytical tool that combines classic pivot reversal levels and Gann geometry
Indicator
Prop
Scalping
Shows bars from different Time Frame on zoom out and hides the current bars. Perfect tool for Multi TF "Market Reply"
Indicator
RSI
MACD
+2
A straightforward yet effective tool signals entry points for both buying and selling. Include 3 Moving Average
11
Sales