"PhantomGrid" logo
PhantomGrid
"PhantomGrid" uploaded image
About trial version
Trial Period = 7 days

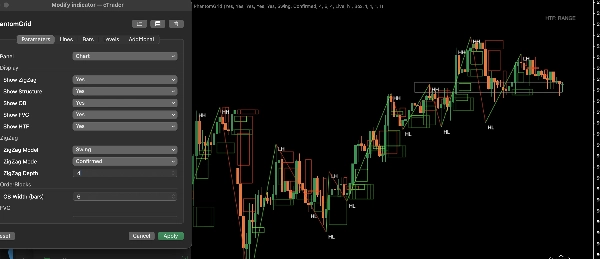
PhantomGrid is a professional-grade grid visualization indicator designed to bring clarity, structure, and precision to price action analysis.

It automatically plots dynamic grid levels across any symbol and timeframe, helping traders identify reaction zones, refine entries and exits, and plan trades with greater consistency.


PhantomGrid is built for both discretionary and systematic traders who want a clean, structured framework without unnecessary chart clutter. The indicator adapts smoothly to changing market conditions while maintaining visual clarity and accuracy across different environments.


Key Features

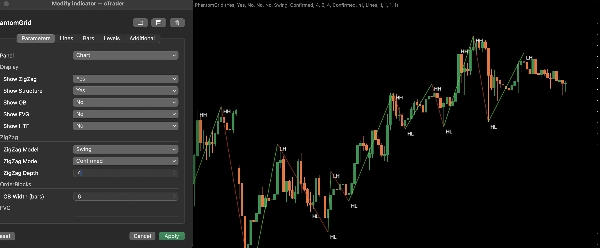
• Automatic dynamic grid plotting across all symbols and timeframes

• Helps identify reaction zones, liquidity areas, and structured setups

• Clean, minimal visual design for distraction-free analysis

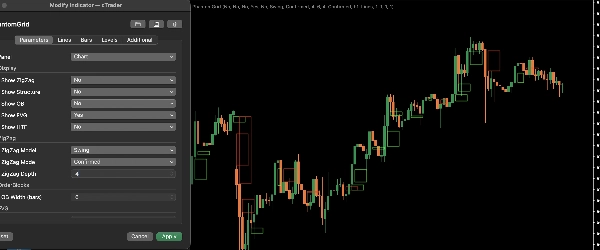
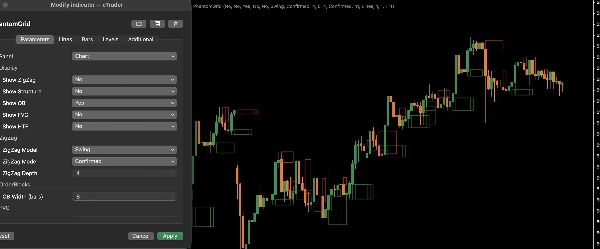
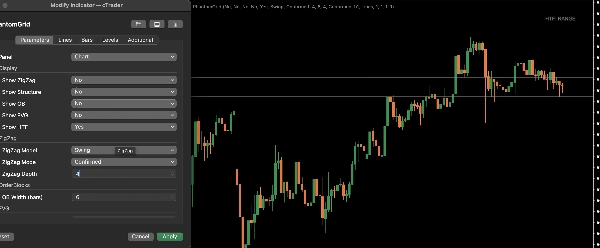
• Fully customizable grid spacing, styling, and behavior

• Lightweight and optimized for smooth performance

• Suitable for scalping, intraday, and swing trading workflows


How Traders Use PhantomGrid

PhantomGrid helps traders:

• structure market movement more clearly

• identify high-probability reaction areas

• improve timing for entries and exits

• manage trades more systematically

• maintain consistency across instruments

It works effectively as a standalone tool or alongside existing strategies and workflows.


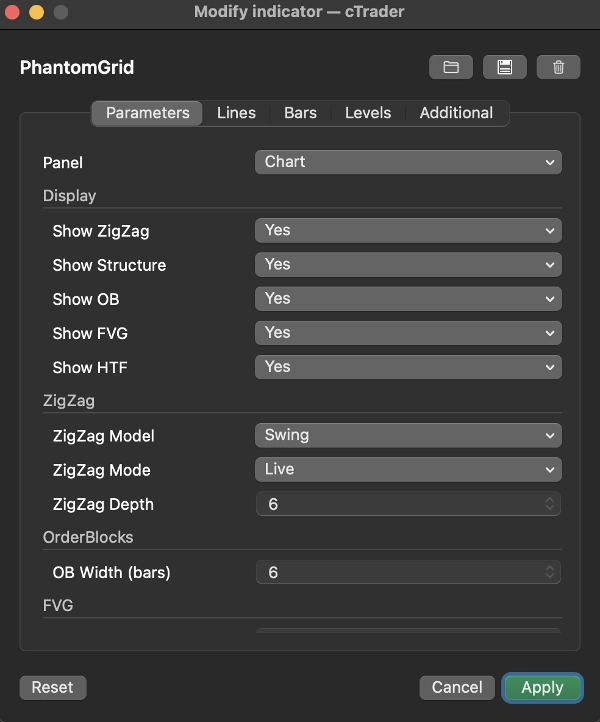
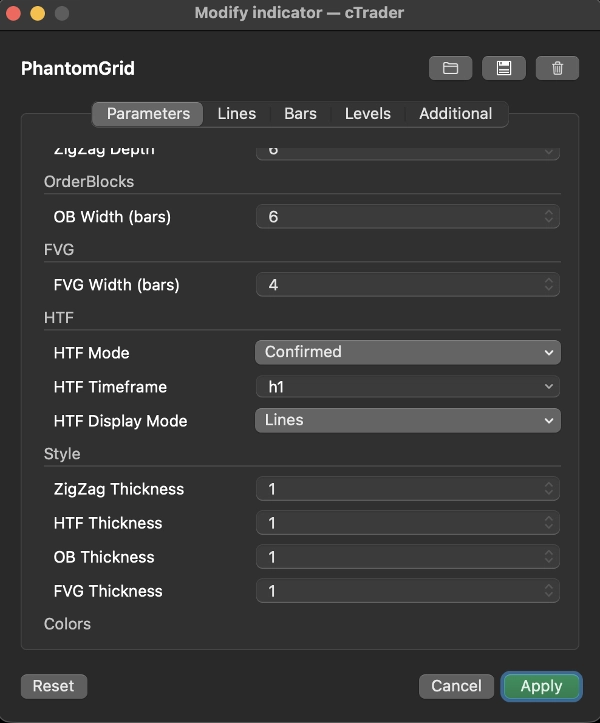
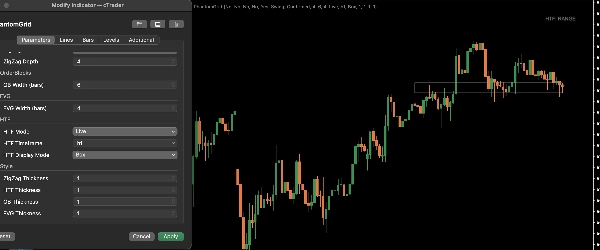
Customization Options

PhantomGrid includes flexible settings to match different trading styles:

• grid spacing controls

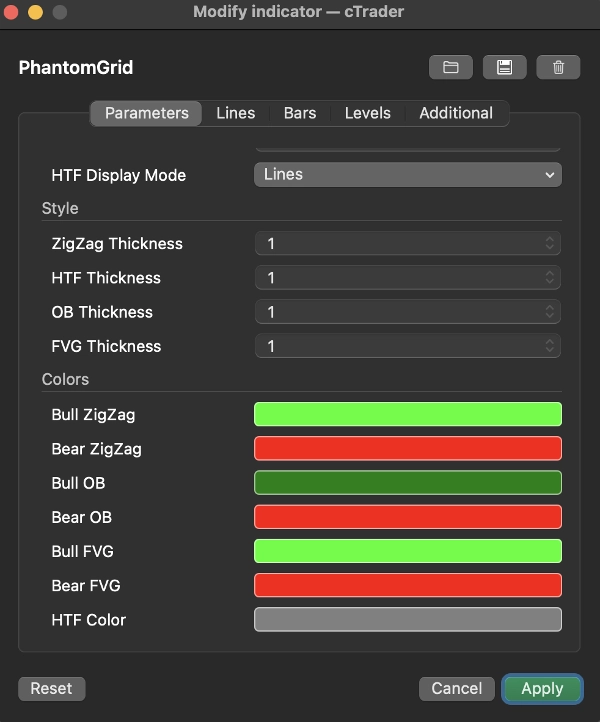
• visual styling and color settings

• visibility adjustments for cleaner layouts

• behavior tuning for different volatility conditions

These options allow traders to tailor the indicator to their exact workflow and preferences.


Performance & Compatibility

PhantomGrid is designed for stable, efficient performance and runs smoothly across all supported symbols and timeframes inside cTrader. The indicator integrates naturally into professional chart setups without slowing platform performance.

Includes full 7-day trial. No limitations.


Past performance does not guarantee future results. This indicator is for informational purposes only and does not constitute financial advice.


About trial version
Trial Period = 7 days
Indicator profile
0.0
Reviews: 0
Customer reviews
No reviews for this product yet. Already tried it? Be the first to tell others!
BTCUSD
Forex
Breakout
Indices
EURUSD
Commodities
GBPUSD
NZDUSD
Fibonacci
VWAP
Scalping
Crypto
Grid
XAUUSD
NAS100
USDJPY
Products available through cTrader Store, including trading bots, indicators and plugins, are provided by third-party developers and made available for informational and technical access purposes only. cTrader Store is not a broker and does not provide investment advice, personal recommendations or any guarantee of future performance.

More from this author

Automatically manages Stop Loss and Take Profit using Support & Resistance levels, with intelligent trailing stop protec
AutoGuard Pro is your silent trading partner protecting every position in real time with precision-engineered stop loss.
DecisionGate is a context-based trade permission indicator for cTrader. It helps you avoid low-quality trades by evaluat

You may also like

heatmap
Integrated Market Analysis: Volume Profile + Statistical Projection 🎯
don't move to the end of chart after timeframe changing. it should be better to use for near history. for long history
Market session indicator (Asia, Frankfurt, New York, London)
A cutting-edge indicator designed to detect and visualize high-probability zones based on swing highs, swing lows.
PnL dashboard with per‑asset exposure, win‑rate, and spread % with dynamic colors.
The Mean Reversion Indicator is designed to identify potential reversal points in the market.
Clean 3D, Sleek Candles for Trend Patterns.
Laguerre RSI: smoother, faster RSI with less noise. Great for spotting reversals and timing entries.
Detect FVGs with age, status, Fibonacci levels, and customizable fill threshold—extended version.
Automatically detects and marks higher highs, lower highs, lower lows and higher lows.Check the other version in my page
Multi-TF OHLC, NY Midnight, ZigZag & Gann S/R—clean visuals for SMC, scalping, and intraday precision.
🔹 Advanced RSI with smart alerts and visual signals for faster trend reversal detection.
Deep Mood Distribution (DMD) is a segmented volume-profile and sentiment tool that analyzes price action in fixed bar bl
Designed to plot a future prediction channel based on Fibonacci retracement levels 📊
Shows bullish/bearish bias for 5 timeframes in one panel. Three bias methods, alignment summary, fully configurable.
"STC" logo
5.0
(2)
Free
Schaff Trend Cycle (STC) Indicator
📈 Anchored VWAP with auto High/Low, session resets, Daily VWAP & TWAP — precise, Pine-accurate port.