

VWAP Stdev Bands
Indicator
Version 1.0, Jul 2026
Windows, Mac

531.58M
Traded volume
9.76M
Pips won
4
Sales
Description
Description & Trading Rules (English Version)
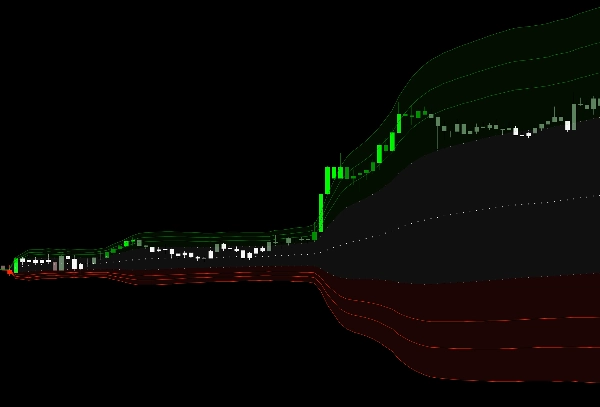
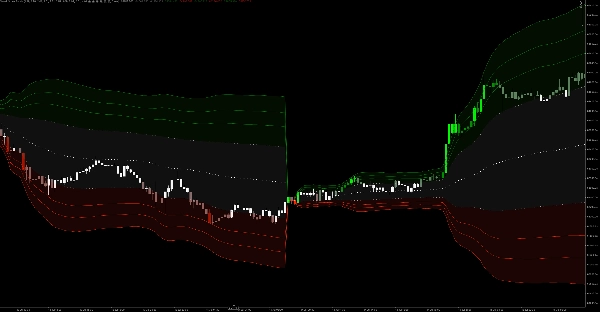
【Indicator Overview】 This indicator revolves around the Daily VWAP (Volume Weighted Average Price) and expands outward with 5 tiers of Standard Deviation (Stdev) bands. Combined with our unique "Candlestick Heatmap" coloring technology, it not only displays dynamic support and resistance zones but also visually highlights extreme overbought and oversold market conditions, helping traders accurately capture mean reversion opportunities.
【Trading Rules】
- Consolidation & Observation Zone (White / Dark Green / Dark Red): When the candles remain within the 1st and 2nd standard deviation bands, the price is fluctuating normally around the moving average. Trend-following or staying on the sidelines is recommended.
- Directional Trend Zone (Green / Deep Red): When the candles break through the 2nd band and enter the 3rd, the trend enters an acceleration phase with strong momentum.
- Extreme Reversion Zone (Lime / Bright Red): When the candles hit the 4th or 5th standard deviation bands and the color turns to the brightest Lime or Red, it signals extreme overbought or oversold market sentiment. A "mean reversion" (sharp reversal) is highly likely to occur, serving as an excellent signal for taking profits or making contrarian entries (fading the top/bottom).
Summary
AI summary
VWAP Stdev Bands is a technical indicator centered on the Daily Volume Weighted Average Price (VWAP) enhanced with five tiers of standard deviation bands. It integrates a dynamic candlestick heatmap coloring system to visually represent support and resistance levels and highlight extreme market conditions. The indicator categorizes price action into zones: a consolidation zone within the first two standard deviation bands indicating normal fluctuation; a directional trend zone beyond the second band signaling strong momentum; and an extreme reversion zone at the fourth and fifth bands, marking overbought or oversold conditions likely to precede sharp reversals. This structure assists traders in identifying mean reversion opportunities and momentum phases. The indicator supports volume and bar data inputs and provides visual outputs suitable for trend analysis, volatility regime detection, reversal signals, breakouts, and level touches or breaks. It is designed for use in markets where VWAP and volume data are available.
Indicator profile
Indicator category
Trend
Output type
Visualisation
Data requirements
Bars only
Volume
Supported signals
Volatility
Trend strength
Reversal
Breakout
Level touch
Level break
Customer reviews
0.0
Reviews: 0
Customer reviews
No reviews for this product yet. Already tried it? Be the first to tell others!
Discussion
FAQ
Volume
Moving Average
VWAP
Support & Resistance
Products available through cTrader Store, including trading bots, indicators and plugins, are provided by third-party developers and made available for informational and technical access purposes only. cTrader Store is not a broker and does not provide investment advice, personal recommendations or any guarantee of future performance.
More from this author






















Price
531.58M
Traded volume
9.76M
Pips won
4
Sales