
Volume Profile Pro
Indicator
8 purchases
Version 1.0, Oct 2025
Windows, Mac
5.0
Reviews: 3
Description
Volume Profile Pro is a professional fixed-range volume analysis tool designed for precise market structure and liquidity mapping.
It lets you visualize how much trading activity occurred at each price level within a defined chart range — helping you instantly identify zones of interest such as high-volume nodes, the Point of Control (POC), and the 70% Value Area.
Key Features
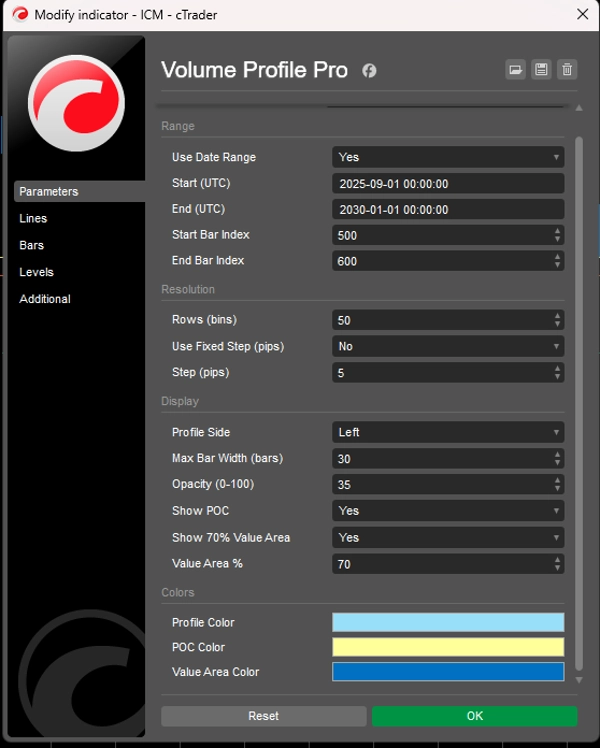
- 🧭 Fixed Range Selection – Define a custom range by date or bar index to analyze only the region you care about.
- 📊 Accurate Volume Distribution – Builds a volume histogram from tick volume across the chosen range.
- 🎯 POC & Value Area – Automatically highlights the Point of Control and the 70% value area band.
- ⚙️ Flexible Resolution – Adjustable bin count or fixed step in pips for custom granularity.
- 🎨 Clean Visualization – Choose side (left/right), width scaling, and opacity for optimal chart readability.
- ⚡ Lightweight & Optimized – Efficient computation for real-time volume studies without slowing your terminal.
How It Works
- Choose whether to use Date Range or Bar Index Range.
- Define your start / end parameters.
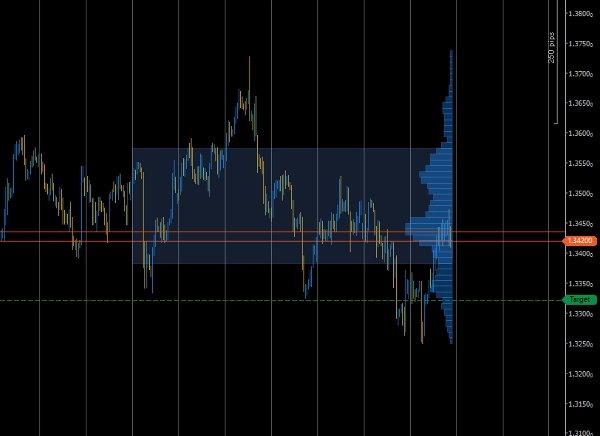
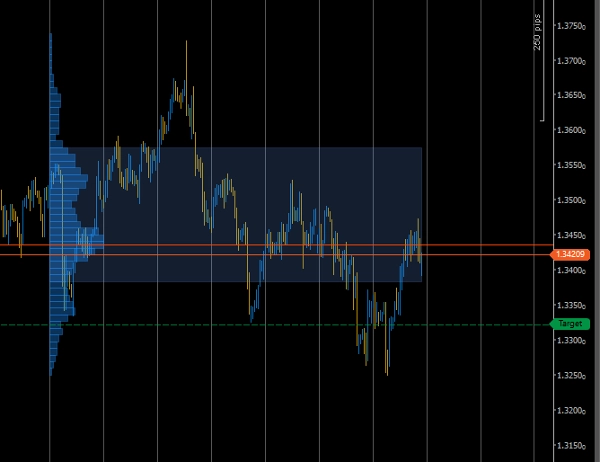
- The indicator calculates tick volume at each price step and plots horizontal bars showing relative activity.
- The longest bar marks the POC, and a lightly-shaded region shows the Value Area (default 70%).
Ideal For
- Intraday and swing traders analyzing liquidity concentration.
- Volume-based strategy developers seeking data-driven zones.
- Traders who use POC or Value-Area reversals/confluence levels.
Summary
AI summary
Volume Profile Pro is a fixed-range volume analysis indicator designed to visualize trading volume distribution by price within a user-defined chart range. It calculates tick volume at each price level and displays a horizontal histogram that highlights key market structure elements such as the Point of Control (POC)—the price with the highest traded volume—and the 70% Value Area, representing the price range where most trading activity occurred. Users can select the analysis range by date or bar index and adjust the resolution through customizable bin counts or fixed pip steps. The indicator offers flexible visualization options, including side placement, width scaling, and opacity adjustments, to enhance chart readability. Its efficient computation supports real-time volume studies without impacting terminal performance. Volume Profile Pro is suitable for intraday and swing traders, volume-based strategy developers, and those utilizing POC or Value Area levels for trading decisions. It supports multiple markets and symbols, including Forex pairs (EURUSD, GBPUSD, NZDUSD, USDJPY), cryptocurrencies (BTCUSD), commodities (XAUUSD), indices (NAS100), and stocks.
Indicator profile
Customer reviews
5.0
Reviews: 3
5 | 100 % | |
4 | 0 % | |
3 | 0 % | |
2 | 0 % | |
1 | 0 % |
Customer reviews
October 20, 2025
Practical market note if the trader wants it adds useful information behind the price move. It works best as support, not a final decision maker. Volume context is stronger when POC, VWAP and value area agree across 2 sessions. volume alone can be noisy without price action.
October 19, 2025
October 19, 2025
Focused demo option for traders who want confirmation beyond candles. It gives value around volume based context, but volume alone can be noisy without price action. I would review 20 reactions near POC or VWAP before trusting the read. The data helps most when price action confirms the same zone.
Discussion
FAQ
BTCUSD
Forex
Indices
EURUSD
Commodities
GBPUSD
NZDUSD
Prop
Crypto
Stocks
XAUUSD
NAS100
USDJPY
VWAP
Products available through cTrader Store, including trading bots, indicators and plugins, are provided by third-party developers and made available for informational and technical access purposes only. cTrader Store is not a broker and does not provide investment advice, personal recommendations or any guarantee of future performance.


Price
Since 31/10/2024
56
Sales
1.75K
Free installs