"VegaXLR - Fibonacci Alerts" logo
VegaXLR - Fibonacci Alerts
"VegaXLR - Fibonacci Alerts" uploaded image
185
Sales
584
Free installs

Fibonacci Alert Indicator

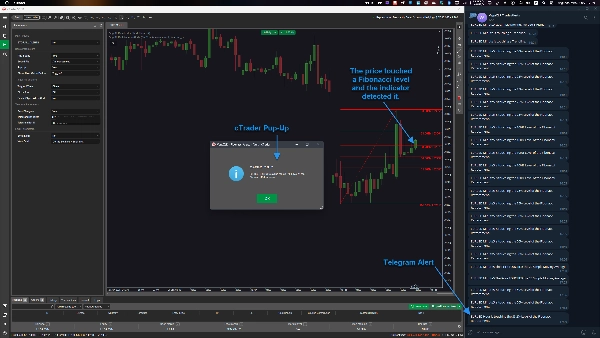
This indicator alerts you when the price reaches Fibonacci Retracements and Expansions on your chart. You can add comments to Fibonacci objects, and these will appear in the alerts—helping you stay organized with your trading ideas.

You have full control over how alerts are sent, with options for sound notifications, pop-up messages, Telegram messages, and emails. Alerts can be triggered immediately when the price touches a level or only after a bar closes, based on the bid or ask price.

With this tool, you no longer need to monitor the charts constantly—just wait for alerts and act based on your strategy.


Features:

Real-time alerts when the price touches Fibonacci levels
Multiple alert types: Telegram, email, pop-up messages, and sound notifications
Built-in cTrader sound alerts (no external files needed)
Custom pop-up system for better notifications
No need for elevated access rights to run the indicator
Stop all alerts option for quick control
Trigger alerts when the bar closes or immediately upon touch
Option to trigger alerts based on bid or ask price
Auto-delete Fibonacci objects after an alert (optional)
Supports multiple Fibonacci objects (unlimited)
Add comments to Fibonacci objects that appear in alerts
Works on any symbol and timeframe in cTrader
Integrated user guide accessible via a small button on the chart

This is a simple yet powerful tool that helps you trade more efficiently by automating Fibonacci level alerts.

Note: This indicator does not draw Fibonacci objects automatically. It detects and works with Fibonacci objects that you manually place on the chart.

Indicator profile
0.0
Reviews: 0
Customer reviews
No reviews for this product yet. Already tried it? Be the first to tell others!
Forex
Products available through cTrader Store, including trading bots, indicators and plugins, are provided by third-party developers and made available for informational and technical access purposes only. cTrader Store is not a broker and does not provide investment advice, personal recommendations or any guarantee of future performance.

More from this author

Centralized access to VegaXLR's cBots, indicators, and educational content in cTrader.
Identify key support and resistance levels through detailed volume distribution analysis.
Free chart themes for the cTrader platform.
This is an indicator that can alert you about trendlines, horizontal lines and vertical lines.
Enhance your trading strategy with automated detection and alerts for key chart patterns.
A powerful cTrader indicator with customizable Moving Average alerts, notifications, and automated trading actions.
Automate lot sizing with cTrader Risk Manager cBot for precise risk management in pending and market orders.
1
Profit factor
0%
Max drawdown
VegaXLR's cTrader StochRSI identifies overbought/oversold RSI levels for precise trade entries.
Real-Time Candlestick Pattern Detection with Custom Alerts & Trend Analysis for cTrader
This is an advanced tool designed to protect your trading account by managing drawdown and run-up levels.
Customizable multi-timeframe pivot point indicator for cTrader with alerts, Fibonacci, CPR, and more!
cTrader ZigZag Alerts: Precision Swing Detection, Alerts, and Fibonacci.

You may also like

The Wyckoff Schematic Indicator is a professional-grade market structure tool designed to automatically detect
Camarilla by Bullitt Traders — a precise, non-repainting pivot indicator for cTrader.
COT Flows. Clear Direction. 🧭
Adaptive Swing-Anchored VWAP that tracks market structure shifts with precision and clarity.
The Pressure Gap indicator identifies sudden price jumps without using volume.
Fair Value Gap (FVG)
Transform your approach to trading with our innovative Pivot Point Indicator.
Multi Timeframe Candle drawing. Draw Any candles from any timeframe on your chart :-)
The Mean Reversion Indicator is designed to identify potential reversal points in the market.
Indicator calculates spread in pips
Identify Overbought & Oversold Levels Like a Pro!
Anchored VWAP Buttons
Marks Monday's OPEN,HIGH & LOW. These are areas of support and resistance for the week.
Self-adapting Kalman filter for cTrader. Smooth trend line with color shifts, optional histogram, no nag screens.
Lightweight utility indicator designed to preload and persist custom colors in cTrader’s “Recent Colors” list.
Chart control panel — zoom presets, timeframe selector, favorite chart buttons, chart type switcher, and bid/ask lines.
CAUTION! THIS TOOL IS FOR PROFESSIONALS ONLY!
This indicator works best as a trend-confirmation tool—wait for multiple signals!
185
Sales
584
Free installs