
VegaXLR - RSI and StochRSI Alerts
Indicator
16 purchases
Version 1.0, Apr 2025
Windows, Mac
4.5
Reviews: 4
Description
VegaXLR - RSI and StochRSI Alerts is a cTrader indicator providing alerts for RSI and StochRSI events, keeping traders informed of market shifts. It notifies users about overbought/oversold levels, centerline crossovers, and K/D line crossovers, all with customizable settings.
Key Features:
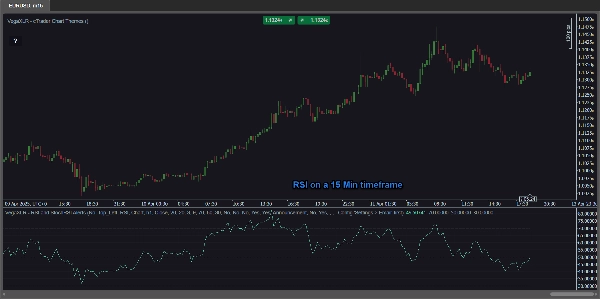
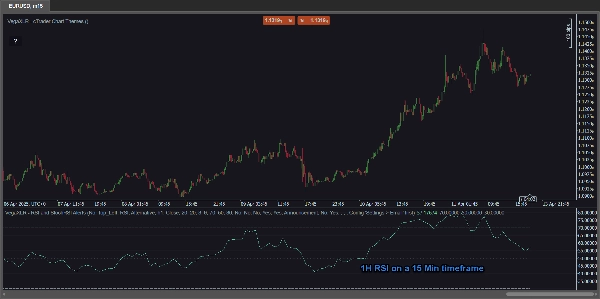
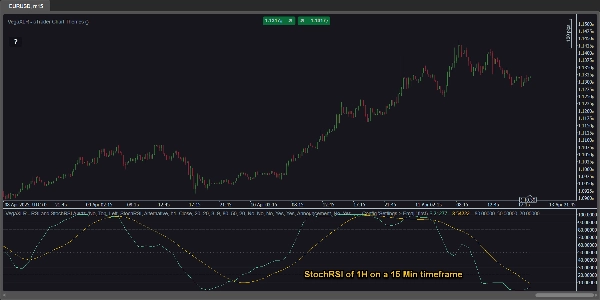
- Multi-Timeframe Analysis: Uniquely view RSI and StochRSI values from any timeframe directly on your current chart. For example, analyze the 1-hour RSI while viewing a 15-minute chart—without changing your chart's timeframe!
- RSI & StochRSI Alerts: Receive notifications for:
- Overbought & oversold conditions
- Center line crossovers (50%)
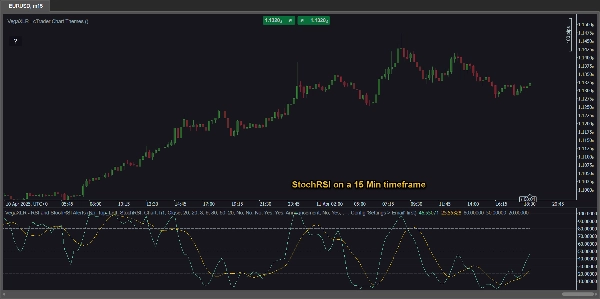
- K and D line crossovers (StochRSI)
- Customizable Settings: Adjust RSI source, periods, K/D values, and alert thresholds for precise control.
- Versatile Alerts: Choose from:
- cTrader popups
- Sound alerts
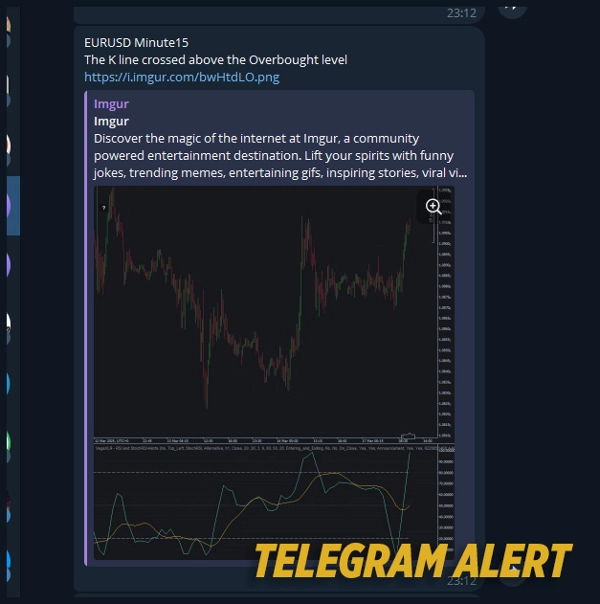
- Telegram alerts (with optional chart screenshots)
- Email notifications
- Integrated RSI & StochRSI Lines: No need for extra indicators—they're built right in!
Instant Access Guide: A convenient in-chart button opens the user manual.
Summary
AI summary
VegaXLR - RSI and StochRSI Alerts is a cTrader indicator designed to monitor and notify traders of key RSI and StochRSI events. It provides alerts for overbought and oversold conditions, centerline (50%) crossovers, and K/D line crossovers within the StochRSI. The indicator supports multi-timeframe analysis, allowing users to view RSI and StochRSI values from any timeframe directly on their current chart without switching timeframes. Customizable settings enable adjustment of RSI source, periods, K/D values, and alert thresholds for tailored monitoring. Alert delivery options include cTrader popups, sound alerts, Telegram notifications (with optional chart screenshots), and email messages. The indicator integrates RSI and StochRSI lines internally, eliminating the need for additional indicators. An in-chart button provides instant access to the user manual for guidance. This tool assists traders in identifying precise market shifts and potential trade entry points based on momentum indicators.
Indicator profile
Customer reviews
4.5
Reviews: 4
5 | 75 % | |
4 | 0 % | |
3 | 25 % | |
2 | 0 % | |
1 | 0 % |
Customer reviews
July 23, 2026
Very good and lots of options, Vega is one of the best. The problem is that the indicator no longer sends alerts, making it a bad choice (purchase). Ctrader is saying the coders are to blame for not udating their algos. I agree in part. However, I'm considering saving my money now as they render half of the indictaors obsolete with 6 monts. Ctrader what are you doing? Dont buy this until a 2026 update because it wont work until Vega fixes what ctrader broke.
April 27, 2025
Steady choice for testing for traders who use momentum confirmation. It gives value around oscillator setups, but strong trends can keep signals stretched. A clean test needs 25 oscillator signals, 2 timeframe confirmation and a clear 1R exit plan. The tool is useful when overbought or oversold is treated as context, not a command.
April 26, 2025
April 26, 2025
Good enough to inspect for oscillator setups. it gives a familiar read on overextension and momentum, especially when used for checking stretched conditions before entries. RSI style levels around 30 and 70 help, but I would add a 2 swing divergence check. The tool is useful when overbought or oversold is treated as context, not a command.
Discussion
FAQ
RSI
Products available through cTrader Store, including trading bots, indicators and plugins, are provided by third-party developers and made available for informational and technical access purposes only. cTrader Store is not a broker and does not provide investment advice, personal recommendations or any guarantee of future performance.


Price
231
Sales
694
Free installs