Indicator
RSI
Breakout
XAUUSD
ATR
Commodities
Signal
Supertrend
Crypto
BTCUSD
Order Block
"Order Block" logo
5.0
13/08/2025
32
Desktop
"Order Block" uploaded image"Order Block" uploaded image"Order Block" uploaded image"Order Block" uploaded image

🚀 10,000+ traders already use our TOP indicators🏆

Discover why professionals choose us – the most powerful tools on cTrader (indicators, algorithms, and cBots) are waiting for you.

👉 Get all our TOP systems here:

_______________________________________________

📌 Market Structure Indicators

·     ✅ AdvancedMarket Structure: Bos, Choch, SwinLevels, Order Blocks,  Market Structure& Liquidity Finder

·     🔄 Dynamic Market StructureAnalysis of Turning Points

·     🧱 Order Block

·     ⚖️ Market Imbalance

·     ⛓️ BOS & CHOCH

·     🧠 ICT Power of 3

·     🌀 Market Polarity Zones

_______________________________________________

🔚 Smart Exit Systems

·     📍 Trailing Smart Algorithm

_______________________________________________

📐 ZigZag Indicators

·     🔍 ZigZag Price LiquidityProjection

·     🧭 S&R Structural ZigZag

·     ➖ ZigZag

·     🎯 Zig-Zag Extremity Tracker

_______________________________________________

🧱 Support & Resistance Indicators

·     🟩 SmartTrend Support &Resistance Lines

·     🧱 All Support and ResistanceLevels

_______________________________________________

📊 Trend & Channel Indicators

·     🔄 Auto-Trend Channel

·     📊 Supertrend

·     ⚡Momentum Trend Analyzer

·     🧠 Adaptive Trend Channel

·     💥 Channel Breakout System

·     🌈 Dynamic Trend Gradient

·     ⭐ PREMIUM SSL CHANNEL

·     🔁 Reactive Moving Average

_______________________________________________

💧 Volume & Liquidity Tools

·     🔥 Volume POC Heatmap

·     📉 Leverage Liquidation Map

·     🔍 Momentum Fair Value Gap

·     🕒 Fair Value Gap Sessions

_______________________________________________

Momentum & RSI Indicators

·     📈 RSI Trend Trigger

·     🚀 Dynamic Range Momentum

·     🔎 Multi-Level Candle Bias
Tracker

_______________________________________________

🔮 Prediction & Projection Tools

·     📐 Prediction Based on Linreg& ATR

·     📏 Fibonacci Linear RegressionMulti-timeframe

·     📈 Volume-Powered Market Flow Projector 

🟢 Identifying Order Blocks 🔴


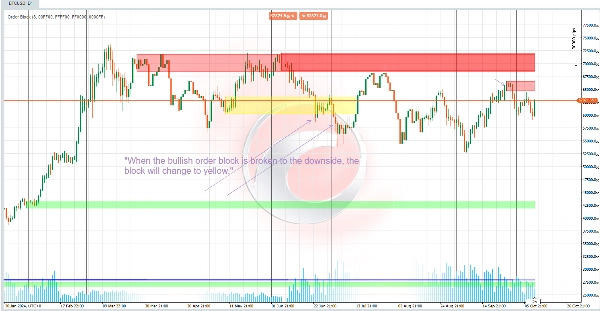
**Bullish Order Block 🚀:**

To spot a bullish order block:

- The code checks if the current closing price surpasses the highest point of a previous swing ⬆️.

- If it does and that swing hasn't been crossed yet, it gets marked as crossed. The order block is then defined from the lowest to the highest price in the previous candles 📈.


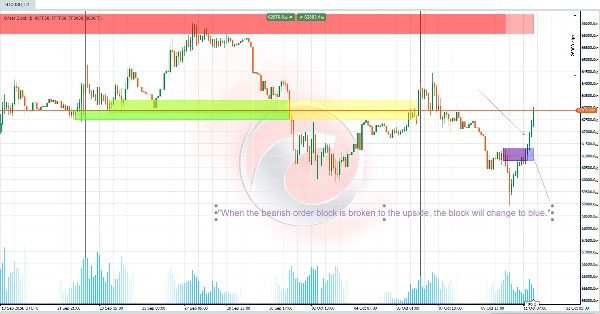
**Bearish Order Block 🔻:**

- This works similarly but applies to low-price swings.

- A bearish order block is created when the current closing price falls below the lowest point of a swing ⬇️.


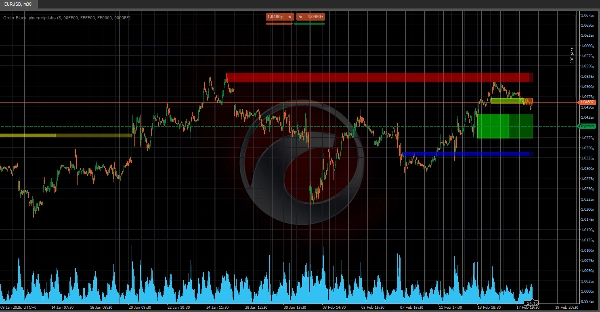
### 💼 Order Block Functionality 📊


Order Blocks represent **high-volume accumulation zones** where big market players may have traded significantly

These areas often act as potential support or resistance levels and can signal trend continuation or reversal 📉📈.


- **Support or Resistance:** Broken order blocks might point to relevant support or resistance areas, depending on the previous trend 🔄.

- **Continuation or Reversal:**

- A break of an order block in the opposite direction can indicate a potential reversal 🔄.

- Breaking in the same direction can confirm the continuation of a trend 🔗.


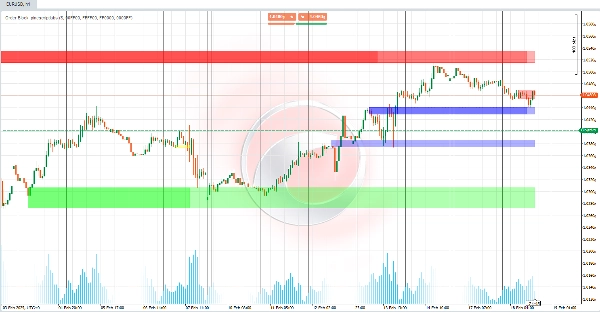
This indicator is powerful for identifying **key levels on charts** 📈, helping traders visualize important areas based on price behavior in high-volume zones. Perfect for spotting trends and market moves! 🎯📊


5.0
Reviews: 1
5
100 %
4
0 %
3
0 %
2
0 %
1
0 %
Customer reviews
August 18, 2025
Automatically identifies bullish and bearish order blocks based on swing breakouts with clear zones. Useful for visual SMC analysis. Cons: No alerts or tooltips. Lacks template saving and volume confirmation features. Slight delay under heavy chart load.
More from this author
Indicator
RSI
Breakout
XAUUSD
+6
ZigZag
ZigZag filters noise, spots trends, patterns, pivots, aiding analysis, trade management, and confirmations. 📉📈
Indicator
RSI
XAUUSD
Breakout
+5
BOS & CHOCH
Market structural patterns , specifically the concepts of Change of Character (ChoCH) 🔄 and Break of Structure (BoS) 💥
Indicator
RSI
Breakout
XAUUSD
+5
Auto-Trend Channel
Adaptive trend channel using linear regression and Pearson correlation for dynamic support, resistance, and trends.
Indicator
RSI
Breakout
Supertrend
All Support and Resistance Levels
"Identify key market zones and visualize support/resistance from multiple timeframes on a single chart.
Indicator
RSI
Breakout
XAUUSD
+5
Zones Supply Demand
📊Zones Supply & Demand: Identifies key price levels with high volume concentration, marking Supply/Demand Zones & Marke
Indicator
RSI
Breakout
XAUUSD
+5
Supertrend
💹 Define a price channel 📈 and determine trend direction (bullish 🟢 or bearish 🔴).
Indicator
RSI
Breakout
XAUUSD
+6
Volume POC Heatmap
📊 Shows volume by price levels, highlights POC, and key zones. Identifies dynamic support/resistance and imbalances.
Indicator
RSI
Breakout
XAUUSD
+4
Dynamic Market Structure Analysis of Turning Points
Identify market structure effortlessly with swing highs, lows, CHoCH, and BOS levels for smart trading decisions! 📊🔍"
Indicator
RSI
Breakout
XAUUSD
+6
Fair Value Gap Sessions
identify and highlight temporary market inefficiencies known as "fair value gaps" 🚨 within specific trading Sessions.
Indicator
RSI
Breakout
Supertrend
Trend Heikin Multi MA
🚀 TrendHeikinMultiMA: Advanced trend detection using Heikin-Ashi smoothing & MAs! Eliminates noise, confirms real trend
Indicator
Indices
RSI
XAUUSD
+7
RSI Divergence
Detects bullish and bearish divergences
Indicator
RSI
Breakout
Supertrend
Leverage Liquidation Map
📊 Liquidation Map: Potential areas where highly leveraged investors might face liquidations.
Indicator
RSI
Breakout
XAUUSD
+4
Multi-Level Candle Bias Tracker
Price direction by calculating the probability of reaching new highs/lows. Shows levels & stats📈
Indicator
RSI
Breakout
Supertrend
Zig-Zag Extremity Tracker
Dynamically adjusts regression channels based on ZigZag extremes, resetting when price breaks bands to track real trends
Indicator
RSI
Breakout
Supertrend
Market Trend OB
Price action to detect when the market changes trend (MSB) and defines, order blocks , ZigZag etc.📊
Advanced Market Structure Bos,Choch,SwinLevels, Order Blog
Advanced price action tool that combines multiple technical analysis concepts
Indicator
RSI
Breakout
Supertrend
+3
Fibonacci Linear Regression Multi-timeframe
Combining Fibonacci levels and regression to analyze multidimensional market trends across multiple timeframes¡
Indicator
RSI
Breakout
ATR
+2
Channel Breakout System
🚀 Specialized algorithm is designed to confirm entry and exit points with precision 🎯
You may also like
Bars color 1
This is the first version I offer you for free.
Indicator
NAS100
RSI
NZDUSD
+16
AlphaTrend Pro Max
Turn data into precision trades with AlphaTrend Pro Max — advanced trend, signal & structure analysis in one.
Indicator
NAS100
NZDUSD
XAUUSD
+8
Pivot Breakout Detector
🎯 Automatically identify significant breakouts from price consolidation zones.
Pivot Points
Pivot Points Indicator
Indicator
Signal
MACD
TradingViewMACD
Enhance your trading strategy with our customizable TradingViewMACD indicator. Optimize and elevate your market analysis
Indicator
Indices
Prop
Stocks
+3
Dynamic Candle Timer v1.5 2025
Dynamic Candle Timer is a fully customizable feature-packed indicator that offers multiple count-down/up modes and...
Indicator
NAS100
Indices
XAUUSD
+2
AlgoCorner DonchianPSAR
Visualize market asymmetry like never before — steady climbs meet sudden drops with the Donchian PSAR
Indicator
Stocks
Forex
Crypto
Quantum Weighted Moving Average (QWMA)
Quantum Weighted Moving Average (QWMA): an advanced moving average that dynamically adjusts weights to market movement
Hull Moving Average Colored
The traditional Hull Moving Average with different colours based on the slope (direction) of the trend.
ADX and ADI
This custom indicator is a complete implementation of the Average Directional Index and Directional Indicators.
Indicator
RSI
Indices
Stocks
+3
FiboTrend-Pro V2
New version of one of my favorites includes Fibonacci and moving average convergence divergence lines
Indicator
NAS100
NZDUSD
Martingale
+26
Support & Resistance Pro
The Support & Resistance Pro helps traders identify key support and resistance levels for informed trading decisions.
Indicator
RSI
Prop
Stocks
+4
Momentum Reversion Model v.2
Visual indicator for identifying momentum reversals. Designed for forex (1h) and stocks (weekly).
Indicator
Indices
E7 BlackScholes Model
Option pricing using the BlackScholes model and the Math.Numerics packages
Indicator
Grid
NAS100
XAUUSD
+6
AutoFibRetracement
A powerful overlay tool designed to automatically plot Fibonacci retracement levels based on a custom window.
MAMA CANDLES
This code implements the MESA Adaptive Moving Average (MAMA) indicator, it creates candles based on MAMA calculations.
BLOCK LIQUIDITY PRO
Block Liquidity,indicator.Block Order, Liquids Stops, Signal Sentiment,signal correctio.
IR Close MTF
this indicator show other time frame close in lower time frame. for ex: show daily close in m 15.