
Opis
Wskaźniki Pinescriptlabs Store: Pinescriptlabs Store cBots : (cBot) Gold & BTC BreakoutSession Pivots(nowy)
Projekcja płynności ceny ZigZag
Trailing Smart Algorithm (nowy)
Prognoza oparta na Linreg & ATR
SmartTrend wsparcie i
opór
linie
Dynamiczna
analiza struktury rynku
punktów zwrotnych
of
Turning
Points
Fibonacci
Regresja liniowa
wielookresowa
Multi-timeframe
Wielopoziomowy
Tracker biasu świecowego
Tracker
Auto
Wsparcie i
opór
linie trendu
Lines
Wszystkie
poziomy wsparcia i
oporów
Levels
📊 Projekcja przepływu rynku:
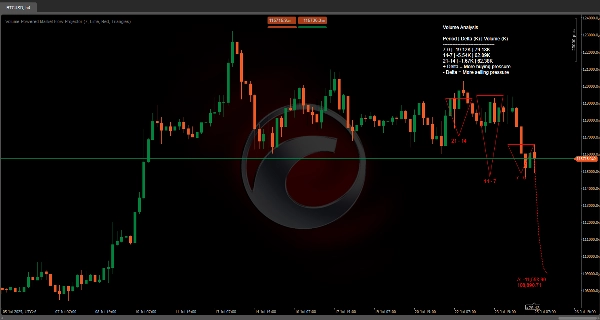
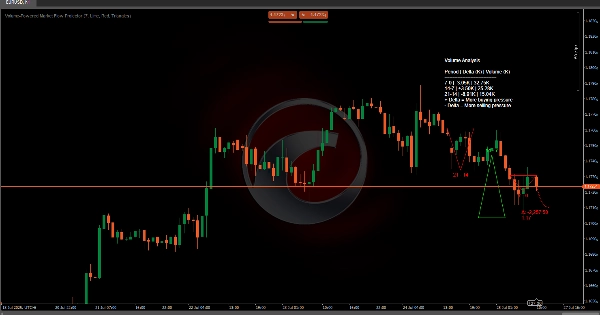
Wskaźnik FutureTrend został zaprojektowany do dynamicznej analizy i prognozowania zachowań rynku poprzez integrację danych o cenie i wolumenie w wielu wymiarach czasowych. Jego kluczowe funkcje obejmują:
⏳ Analiza trzech okresów
📈 Oblicza średnie ceny (maksima i minima) oraz delta wolumen (różnica między presją kupna a sprzedaży) w trzech kolejnych okresach zdefiniowanych przez parametr Period.
🔍 Ten skonsolidowany widok historycznych ruchów pomaga zidentyfikować dominujące trendy i zmiany w zachowaniu rynku.
🚀 Projekcja przyszłej linii trendu
📊 Korzystając z ważonej średniej delta wolumenów z trzech analizowanych okresów, wskaźnik prognozuje przyszłą linię trendu, która odzwierciedla możliwy kierunek rynku.
🛠️ Projekcja jest dynamicznie dostosowywana za pomocą czynników wygładzających, aby uniknąć ekstremalnych prognoz.
🔷 Wizualna reprezentacja kształtów
🎨 Dane historyczne są wizualnie przedstawione za pomocą kształtów geometrycznych (trójkąty, koła lub prostokąty), które ilustrują ewolucję wolumenu i zakresów cen dla każdego okresu.
🔴🟢 Przypisane kolory (UpColor i DownColor) wskazują dominujący trend (byczy lub niedźwiedzi), umożliwiając szybką interpretację.
🏷️ Średnia delta wolumenu i etykieta przyszłej ceny
📍 Na końcu prognozowanej linii trendu znajduje się etykieta wyświetlająca średnią deltę wolumenu oraz szacowaną przyszłą cenę, oferując kluczowy punkt odniesienia dla potencjalnych ruchów cen i siły trendu.
📋 Tabela danych wolumenu
📑 Zapewnia szczegółową tabelę rozkładającą całkowite wolumeny i różnice delta dla trzech analizowanych okresów.
📊 Umożliwia to traderom szybkie porównanie danych wolumenowych, interpretację kontekstu rynkowego i wsparcie prognozy przyszłego trendu.
🔮 Kierunek
Poprzez łączenie danych o wolumenie i cenie, wskaźnik oferuje solidne narzędzie do przewidywania zarówno siły trendu, jak i potencjalnych zmian w zachowaniu rynku w nadchodzących okresach.
Podsumowanie
The indicator projects a future trendline based on a weighted average of delta volumes from the analyzed periods, dynamically adjusted with smoothing factors to prevent extreme predictions. Historical data is visually represented using geometric shapes—such as triangles, circles, or boxes—that illustrate volume and price range evolution for each period. Colors indicate prevailing trends, with distinct hues for bullish and bearish conditions.
At the end of the projected trendline, a label displays the average delta volume and estimated future price, providing a reference for potential price movements and trend strength. Additionally, a detailed volume data table breaks down total volumes and delta differences for the three periods, supporting market context interpretation and trend projection. By combining volume and price data, this tool aids in predicting trend strength and potential market behavior shifts.
Opinie klientów
5 | 100 % | |
4 | 0 % | |
3 | 0 % | |
2 | 0 % | |
1 | 0 % |


