
Opis
Wskaźniki Pinescriptlabs Store: Pinescriptlabs Store cBoty : (cBot) Gold & BTC BreakoutSession Pivots(nowy)
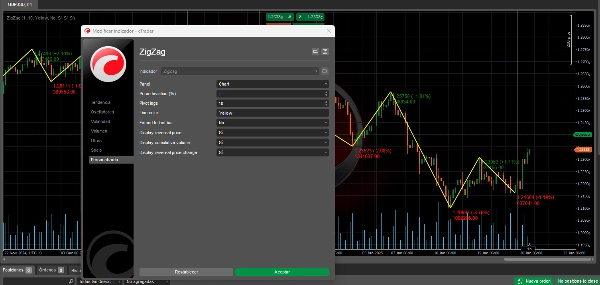
Projekcja płynności ceny ZigZag
Inteligentny algorytm podążający (nowy)
Prognoza oparta na Linreg & ATR
SmartTrend wsparcie i
opór
linie
Dynamiczna
analiza struktury rynku
punktów zwrotnych
(Turning)
Points
Fibonacci
Regresja liniowa
wieloczasowa
Multi-timeframe
Wielopoziomowy
śledzik świecowy
Tracker
Automatyczne
wsparcie i
opór
linie trendu
Lines
Wszystkie
wsparcia i
opory
Poziomy
Wskaźnik ZigZag: Upraszczanie trendów rynkowych 📉📈
ZigZag to wskaźnik techniczny, który pomaga zidentyfikować znaczące zmiany trendu aktywa, filtrując drobne ruchy rynkowe. Jego głównym celem jest uproszczenie wizualnej analizy cen poprzez eliminację "szumu" małych wahań.
Jak to działa ⚙️
- 📊 Analizuje ceny, aby znaleźć znaczące punkty zwrotne (pivoty).
- 📈 Punkt zwrotny uznaje się za istotny, gdy cena zmienia się o określony minimalny procent (parametr odchylenia).
- 🔗 Łączy te punkty zwrotne prostymi liniami, tworząc wzór "zigzag".
- 🕒 Aktualizuje się dynamicznie wraz z pojawianiem się nowych danych cenowych.
Przydatność w handlu 💡
Identyfikacja trendu 📐
- 🔍 Pomaga wizualizować główny kierunek rynku.
- 🚀 Ułatwia dostrzeżenie trendów wzrostowych i spadkowych.
- 📏 Wyraźnie podkreśla kluczowe poziomy wsparcia i oporu.
Analiza wzorców 📋
- 🎯 Upraszcza identyfikację formacji wykresów.
- 🕵️♂️ Podkreśla formacje cenowe takie jak trójkąty, flagi i inne wzory.
- 🌊 Zwiększa przejrzystość przy rozpoznawaniu fal Elliotta.
Zarządzanie transakcjami 🎛️
- 🎯 Identyfikuje potencjalne punkty wejścia i wyjścia.
- 🛡️ Pomaga określić poziomy stop-loss na podstawie poprzednich pivotów.
- 🎯 Ułatwia ustalanie realistycznych celów cenowych.
Analiza zmienności 🌡️
- 📏 Odległość między pivotami odzwierciedla zmienność rynku.
- 🧩 Pomaga dostosować strategie do wielkości ruchów.
- ⏳ Rozróżnia okresy konsolidacji od trendów kierunkowych.
Potwierdzenie sygnału ✅
- 🔍 Służy jako narzędzie potwierdzające dla innych wskaźników.
- 🚪 Potwierdza wybicia kluczowych poziomów.
- 🔗 Może być łączony z innymi wskaźnikami dla bardziej solidnych strategii.
Kluczowe uwagi 🧠
Jest retrospektywny 📅
- ⏪ Punkty pivot są potwierdzane dopiero po wystąpieniu ruchu.
- 🔮 Sam w sobie nie jest predykcyjny.
- ⚖️ Powinien być używany w połączeniu z innymi wskaźnikami do podejmowania decyzji.
Dostosowanie parametrów 🔧
- 🎚️ Czułość zależy od ustawionego procentu odchylenia.
- 🔍 Mniejszy procent pokazuje więcej punktów pivot.
- 🧹 Wyższy procent filtruje drobne ruchy, pokazując tylko znaczące zmiany.
Użycie na różnych ramach czasowych 🕒
- 🕰️ Działa na dowolnej ramie czasowej.
- 🔄 Parametry powinny być dostosowane do horyzontów handlowych.
- 🌐 Analiza na wielu ramach czasowych oferuje bardziej kompleksowy obraz.
📈 Używaj wskaźnika ZigZag jako potężnego narzędzia do uproszczenia analizy, identyfikacji trendów i poprawy podejmowania decyzji w swojej przygodzie z handlem! 🚀
Podsumowanie
Key functionalities include:
- Trend Identification: Visualizes primary market direction, highlights bullish and bearish trends, and marks key support and resistance levels.
- Pattern Analysis: Simplifies recognition of chart patterns such as triangles, flags, and Elliott waves.
- Trade Management: Assists in identifying entry and exit points, setting stop-loss levels based on previous pivots, and establishing realistic price targets.
- Volatility Analysis: Reflects market volatility through pivot distances, aiding strategy adjustments and distinguishing consolidation from trending phases.
- Signal Confirmation: Validates breakouts and complements other indicators for robust trading strategies.
The indicator is retrospective, confirming pivots only after price movements occur, and is not predictive on its own. Sensitivity can be adjusted via the deviation percentage to show more or fewer pivot points. It is compatible with any timeframe and benefits from multi-timeframe analysis for comprehensive market views.
This tool supports analysis across various markets including cryptocurrencies (BTCUSD), commodities (XAUUSD), and others, and integrates with related indicators like RSI, ATR, and Supertrend.
Opinie klientów
5 | 50 % | |
4 | 33 % | |
3 | 17 % | |
2 | 0 % | |
1 | 0 % |


