Описание
Index Hunter: Обзор
Index Hunter — это специализированный технический индикатор и система поддержки принятия решений, разработанная в первую очередь для индексов с высокой волатильностью, таких как US30 (Dow Jones) и NAS100 (Nasdaq). В отличие от стандартных индикаторов, которые показывают только прошлые данные, Index Hunter сосредоточен на «векторном прогнозе» — пытаясь предсказать, где цена, вероятно, будет через 4 свечи в будущем, основываясь на текущей скорости (наклоне) по нескольким таймфреймам.
1. Основные механизмы (Как это работает)
A. Прогностический движок «Вектор»
Это сердце инструмента. Он не просто смотрит на текущую цену; он вычисляет скорость изменения (наклон) по таймфреймам M5, M15 и H1, чтобы нарисовать «путь в будущее» на вашем графике.
- Механика: Он вычисляет взвешенное среднее импульса с разных таймфреймов, чтобы спрогнозировать 4 точки (P1, P2, P3, P4) в будущем.
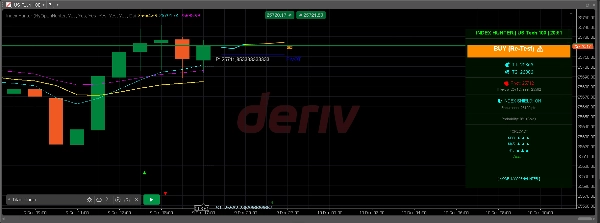
- Визуализация: Вы видите цветной путь (Голубой -> Желтый -> Оранжевый), идущий вправо от цены, визуализируя инерцию рынка.
- Призрачный путь: Он также запоминает предыдущий прогноз (Призрачный путь), чтобы вы могли видеть, соблюдает ли рынок прошлые прогнозы алгоритма (так называемая «проверка реальности»).
B. Многоуровневая визуальная система
Автоматически накладывает критические институциональные уровни:
- Пивотные точки (гибкие): Автоматически рассчитывает уровни Pivot, R1/S1 и R2/S2 на основе выбранного таймфрейма (H12, Daily, Day2 или Day3).
- Психологические уровни: Рисует «психологические линии» на каждом интервале в 100 пунктов (например, 34000, 34100), которые часто выступают магнитными зонами для индексов.
- Дневной максимум/минимум: Отмечает диапазон предыдущего дня, чтобы показать зоны пробоя или отскока.
- Фракталы: Определяет локальные вершины и основания стрелками (▲ ▼) для точного размещения входа/стоп-лосса.
C. Логика «Уверенности» и Реалистичности
Инструмент не просто выдает сигнал; он его оценивает.
- Расчет: Он измеряет расстояние до вашей цели по прибыли и сравнивает его с текущей энергией рынка (ATR - Средний истинный диапазон).
- Результат:
-
- ГОРЯЧИЙ (>80%): Сильный импульс + разумное расстояние до цели.
- ТЕПЛЫЙ (50-80%): Умеренная настройка.
- ХОЛОДНЫЙ (<50%): Рынок предполагает низкую вероятность достижения цели (например, цель слишком далеко при текущей волатильности).
D. Механика «Щита» счета
В панели есть пассивный менеджер риска:
- Метрика выносливости: Вычисляет, на сколько «пунктов» рынок может пойти против вас, прежде чем ваш счет окажется в опасности, исходя из вашего баланса и минимального размера лота.
- Статус: Отображает «🛡️ ЩИТ ИНДЕКСА: ВКЛ» если ваш счет в безопасности относительно текущей волатильности (ATR), или «⚠️ НИЗКАЯ МАРЖА» если волатильность слишком высокая для вашего баланса.
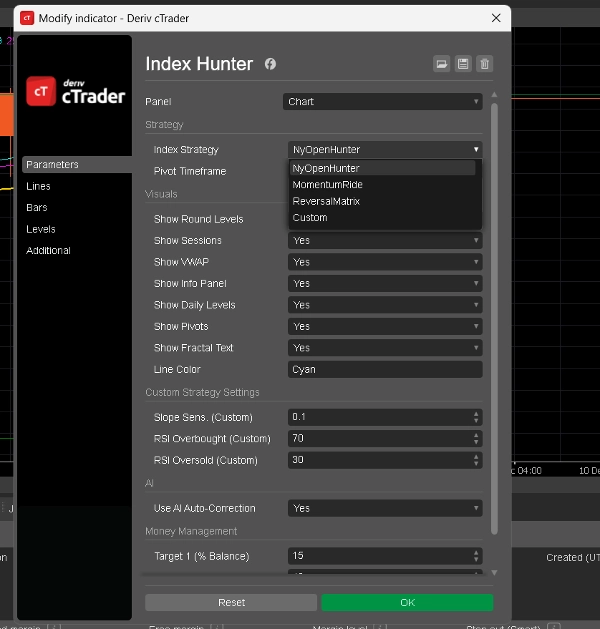
2. Доступные режимы (стратегии)
Вы можете переключаться между этими режимами в настройках индикатора (
Index Strategy
параметр). Каждый режим меняет то, как ИИ интерпретирует рынок.
1. Режим: NyOpenHunter (Нью-Йоркский скальпер)
- Лучше всего для: Хаотичных первых 2-3 часов открытия рынка США.
- Логика:
-
- Активное время: 13:00 - 17:00 UTC (примерно).
- Триггер: Ищет наклон M5 больше 0.1 (или меньше -0.1).
- Философия: «Поймай взрыв». Ждет начальный всплеск объема в момент открытия Нью-Йорка и сигнализирует о том, чтобы поймать эту волну.
- Настроение панели: Показывает «NY OPEN BUY 🚀» или «NY OPEN SELL 🔻».
2. Режим: MomentumRide (Следование за трендом)
- Лучше всего для: Сильных, устойчивых трендов вне времени открытия.
- Логика:
-
- Триггер: Требует более сильного наклона M5 (> 0.2), чем в режиме NY.
- Философия: «Не попадай под рубанок». Игнорирует слабые движения и сигнализирует только тогда, когда рынок движется с значительной уверенностью.
- Настроение панели: Показывает «MOMENTUM UP 🟢» или «MOMENTUM DOWN 🔴».
3. Режим: ReversalMatrix (Контртренд)
- Лучше всего для: Флэтовых рынков или ловли вершин/низов.
- Логика:
-
- Триггер: Использует RSI (Индекс относительной силы).
-
- Сигнал на продажу: RSI > 75 (перекупленность).
- Сигнал на покупку: RSI < 25 (перепроданность).
- Философия: «Отбивайся от крайностей». Определяет, когда резинка слишком сильно растянута и, вероятно, рванет обратно.
- Настроение панели: «ПЕРЕКУПЛЕН (СКОРО ПРОДАЖА)» или «ПЕРЕПРОДАН (СКОРО ПОКУПКА)».
4. Режим: Custom (Пользовательский)
- Лучше всего для: Продвинутых пользователей, желающих настроить бота.
- Логика: Позволяет задать собственные пороги для чувствительности наклона и уровней RSI в настройках.
-
- Пример: Вы можете создать гибридную стратегию, которая покупает только если наклон > 0.05 И RSI < 40.
3. «Информационная панель» (HUD)
Визуальная панель справа от графика объединяет все эти данные:
- Заголовок: Показывает текущий режим и символ.
- Предпочтение: Основной уклон ИИ (например, «BUY 34150 ▲»).
- Цели (T1, T2): Динамические цели прибыли, рассчитанные на основе процентных настроек вашего счета и волатильности.
- Прогноз: Последовательный анализ трендов M30, M45 и H1 (например, «M30: ▲ ▲ ▲» означает сильное согласие на покупку).
- Вероятность: Оценка уверенности ИИ (Горячий/Теплый/Холодный).
Сводка
Key features include an automatic overlay of institutional levels such as pivot points (with selectable timeframes), psychological price levels at 100-point intervals, previous day’s high/low, and fractals marking local tops and bottoms. It incorporates a confidence grading system (Hot, Warm, Cold) based on momentum strength and volatility relative to profit target distance.
Index Hunter includes a risk management "Shield" that assesses account safety by calculating potential adverse market moves against account balance and lot size, displaying status alerts accordingly.
The indicator offers four operational modes: NyOpenHunter (New York market open scalping), MomentumRide (trend following), ReversalMatrix (counter-trend using RSI), and a Custom mode for user-defined slope and RSI thresholds. A comprehensive info panel consolidates mode, bias, dynamic targets, trend forecasts, and confidence scores for decision support.
Отзывы покупателей
5 | 67 % | |
4 | 33 % | |
3 | 0 % | |
2 | 0 % | |
1 | 0 % |