
FX Sniper
Wskaźnik
5 zakupy
Wersja 2.0, Dec 2025
Windows, Mac
4.6
Opinie: 3
Opis
FX Sniper: Zaawansowane filtrowanie dla głównych par walutowych
- FX Sniper jest specjalistycznym narzędziem analizy technicznej zaprojektowanym dla rynku Forex (główne pary takie jak EURUSD, GBPUSD, USDJPY). W przeciwieństwie do Index Hunter (który ściga zmienność), FX Sniper jest zbudowany dla precyzji i filtrowania, pomagając unikać rynków "whipsaw" poprzez potwierdzanie trendów na wielu ramach czasowych przed sygnalizacją.
- 1. Podstawowe mechanizmy
- A. "Tłumiony" wektor prognozy
- Pary Forex są bardziej hałaśliwe niż indeksy. FX Sniper używa zmodyfikowanego algorytmu nachylenia z "czynnikiem tłumienia" (współczynnik 0,8x).
-
- Co robi: Celowo zmniejsza czułość na drobne skoki cen.
- Wizualizacja: Rysuje linię prognozy z 4 punktów (Cyjan -> Żółty -> Pomarańczowy), która prognozuje cenę na 4 świece do przodu.
- Różnica w stosunku do Index Hunter: Krzywa prognozy jest "cięższa" i gładsza, filtrując szumy rynkowe, aby pokazać prawdziwy przepływ instytucjonalny.
- B. Wyrównanie wieloramowe (tzw. "Sniper Scope")
- Nie ufa pojedynczej ramie czasowej. Logika "Snipera" wymaga wyrównania:
-
- Trend makro: Sprawdza nachylenie H1 i H4.
- Momentum mikro: Sprawdza nachylenie M5 i M15.
- Sygnał: Generuje "byczy" lub "niedźwiedzi" bias tylko wtedy, gdy te ramy czasowe się zgadzają, zmniejszając fałszywe sygnały na rynkach bocznych.
- C. System pivotów kroczących (H12 / 48h / 72h)
- Standardowe dzienne pivoty często zawodzą na rynku Forex 24/5. FX Sniper wprowadza "struktury kroczące":
-
- Elastyczne ramy czasowe: Możesz ustawić pivoty do obliczania na podstawie ostatnich 12 godzin, 48 godzin (2 dni), lub 72 godzin (3 dni).
- Zastosowanie: Pomaga zidentyfikować istotne wielodniowe poziomy strukturalne, na które reagują algorytmy, zamiast arbitralnego poziomu resetu o "północy".
- D. Ochrona konta ("Świadomość marginesu")
-
- Kalkulator wartości pipsa: Automatycznie wykrywa, czy handlujesz parą Cross (np. GBPJPY) vs. główną (EURUSD) i dostosowuje obliczenia ryzyka.
- Metryka wytrzymałości: Wyświetla twoją "przeżywalność" w pipsach.
-
- Tarcza WŁĄCZONA: Zielony status oznacza, że twój wolny margines może wytrzymać znaczną zmienność (ruchy odchylenia standardowego).
- Tarcza WYŁĄCZONA: Czerwone ostrzeżenie, jeśli twoja dźwignia jest zbyt wysoka względem zmienności obecnej pary.
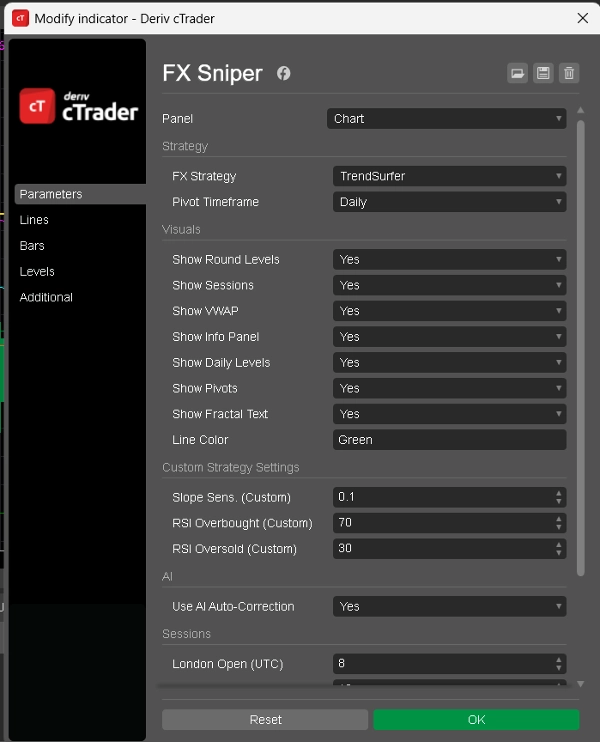
- 2. Dostępne tryby (strategie)
- Możesz przełączyć
Fx Strategy- parametr, aby zmienić zachowanie bota:
- 1. Tryb: TrendSurfer (Podążanie za trendem)
-
- Najlepszy dla: Łapania "wielkiego ruchu" dnia (nakładka Londyn/NY).
- Logika:
- 2. Tryb: RangeBound (Rewersja do średniej)
-
- Najlepszy dla: Sesji azjatyckiej lub zmiennych popołudni.
- Logika:
-
- Wyzwalacz: Czysto na podstawie ekstremów RSI.
-
- Sprzedaj: RSI > 70 ("SPRZEDAJ NA SZCZYCIE").
- Kup: RSI < 30 ("KUP NA DOLE").
- Filozofia: "Kupuj tanio, sprzedawaj drogo." Zakłada, że rynek utknął w pudełku i gra na krawędziach.
- 3. Tryb: KeyLevelSniper (Struktura)
-
- Najlepszy dla: Handlu odbiciami od sztywnych poziomów.
- Logika:
-
- Wyzwalacz: Używa uproszczonego filtra nachylenia H1, ale weryfikuje go względem odległości poziomu pivot.
- Filozofia: Koncentruje się na akcji cenowej w pobliżu pivotów H12/Dziennych/Day2 zdefiniowanych w twoich ustawieniach.
- 4. Tryb: Custom (definiowany przez użytkownika)
-
- Najlepszy dla: Strategii hybrydowych.
- Logika:
-
- Pozwala łączyć ręcznie nachylenie (momentum) i RSI (rewersję).
- Przykład: ustaw
Slope Sens
na 0.1 oraz
RSI Over
na 80, aby stworzyć "super ekstremalny" setup odwrócenia.
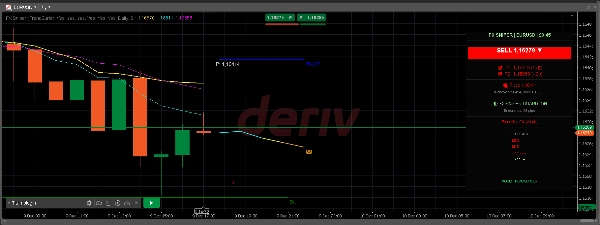
- 3. Panel informacyjny
Panel (w prawym górnym rogu) to twoja kabina pilotów:
- Nagłówek analizy: Wyświetla aktualną parę i znacznik czasu "Snipera".
- Preferencje: "KUP" lub "SPRZEDAJ" z określoną ceną wejścia.
- Cele (T1 / T2): Obliczane na podstawie zmienności ATR (np. "T1: +20 pipsów").
- Ocena wykonalności:
-
- Silna (Lima): >80% prawdopodobieństwa (transakcja zgodna z trendem H4 + miejsce na ruch).
- Umiarkowana (Żółta): 50-80% (ważny setup, ale może mniejsza zmienność).
- Słaba (Czerwona): Ryzyko/zysk nie ma sensu (cel jest zbyt daleko względem ATR).
- Historia: Rejestr "Wygranych/Przegranych" ostatnich 10 sygnałów wygenerowanych przez bota w bieżącej sesji (wyświetlany jako ✅ lub ❌).
Podsumowanie
Podsumowanie AI
FX Sniper is a technical analysis indicator designed for multi-pair Forex trading, focusing on major currency pairs such as EURUSD, GBPUSD, and USDJPY. It employs advanced filtering techniques to reduce market noise and avoid false signals by confirming trends across multiple timeframes before generating trade biases.
Key features include:
- A "Dampened" Vector Forecast that projects price movement four candles ahead using a modified slope algorithm with reduced sensitivity to minor price spikes.
- Multi-Timeframe Alignment ("Sniper Scope") that requires agreement between macro trends (H1 and H4 slopes) and micro momentum (M5 and M15 slopes) to signal bullish or bearish bias.
- A Rolling Pivot System offering flexible pivot calculations over 12, 48, or 72-hour periods to identify significant multi-day structural levels.
- Account Protection tools that automatically adjust risk calculations based on pair type and display margin endurance status.
FX Sniper supports four operational modes: TrendSurfer (trend following), RangeBound (mean reversion), KeyLevelSniper (structure-based trading), and a Custom mode allowing user-defined combinations of momentum and RSI parameters.
An integrated information panel provides real-time analysis, including trade preference, entry price, ATR-based targets, feasibility scores, and recent signal performance. This tool is intended to assist traders in making informed decisions by filtering out noise and confirming trend strength across timeframes.
Profil wskaźnika
Opinie klientów
4.6
Opinie: 3
5 | 67 % | |
4 | 33 % | |
3 | 0 % | |
2 | 0 % | |
1 | 0 % |
Opinie klientów
December 22, 2025
FX Sniper is a fast momentum-based entry tool. Clean signals, lightweight and responsive, ideal for intraday timing. Best used as confirmation with structure and trend filters. Can be noisy on lower TFs, but filtering makes it effective.
December 19, 2025
The good surprise is the setup needs less second guessing. It is not the entire strategy.
December 19, 2025
Dyskusja
Częste pytania
Forex
Signal
Scalping
EURUSD
GBPUSD
NZDUSD
RSI
AI
ATR
Bollinger
USDJPY
VWAP
Produkty dostępne za pośrednictwem cTrader Store, w tym boty handlowe, wskaźniki i wtyczki, dostarczane są przez deweloperów zewnętrznych i udostępniane wyłącznie w celach informacyjnych oraz w celu zapewnienia dostępu technicznego. cTrader Store nie jest brokerem i nie zapewnia doradztwa inwestycyjnego, nie udziela spersonalizowanych rekomendacji ani nie gwarantuje przyszłych wyników.


![Logo „High-Low Divergence [Iridio Capital]”](https://cdn.ctrader.com/image/webp/443c4661-7abb-40f1-842f-4b6ec560649b_40914)


Cena
Od 08/11/2025
23
Sprzedaż
59
Bezpłatne instalacje