
Opis
MACD Advanced — Opis wskaźnika
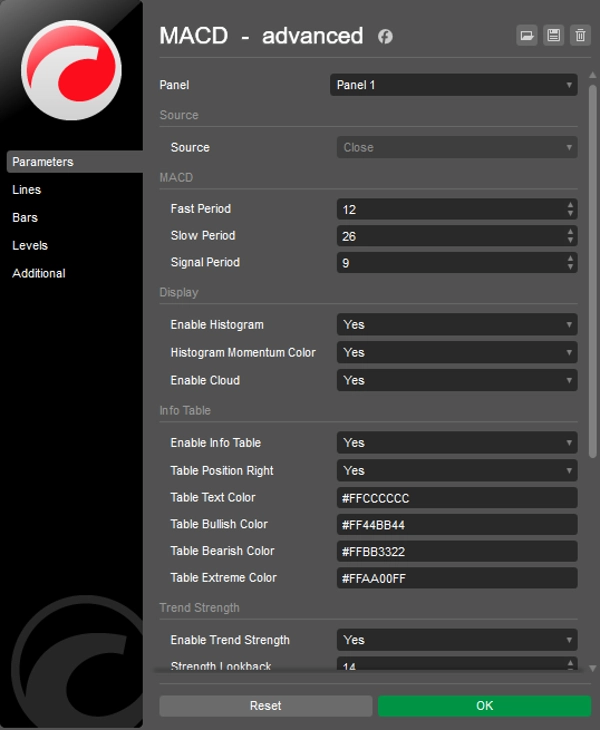
MACD Advanced to profesjonalna wersja klasycznego wskaźnika MACD dla cTrader. Łączy standardową logikę MACD z bogatym zestawem narzędzi wizualnych i warstw analitycznych, dając traderom znacznie głębszy wgląd w momentum rynku, siłę trendu oraz warunki zmienności — wszystko w jednym panelu.
Histogram z kolorowaniem momentum
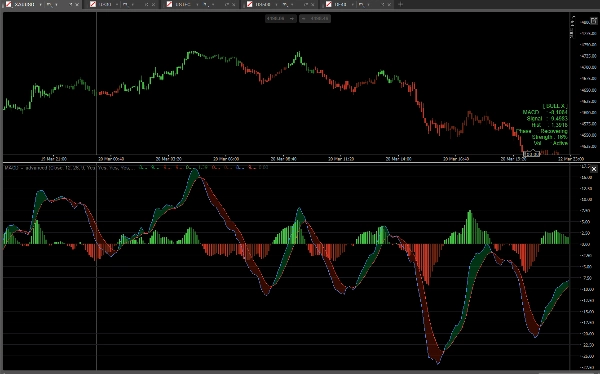
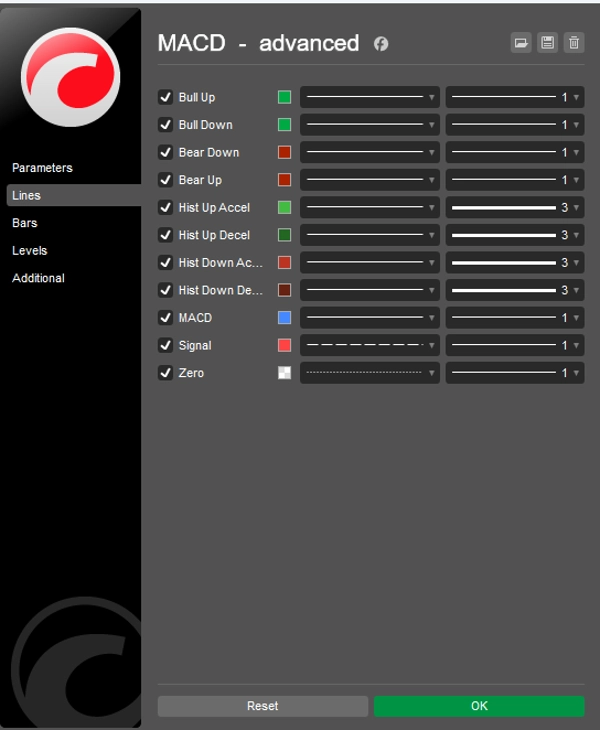
Histogram pokazuje różnicę między liniami MACD i Signal oraz używa czterech oddzielnych kolorów, aby rozróżnić cztery stany rynku: byczy przyspieszający, byczy zwalniający, niedźwiedzi przyspieszający i niedźwiedzi zwalniający. Dzięki temu od razu widać, czy momentum rośnie, czy słabnie, bez konieczności ręcznych obliczeń.
Chmura MACD
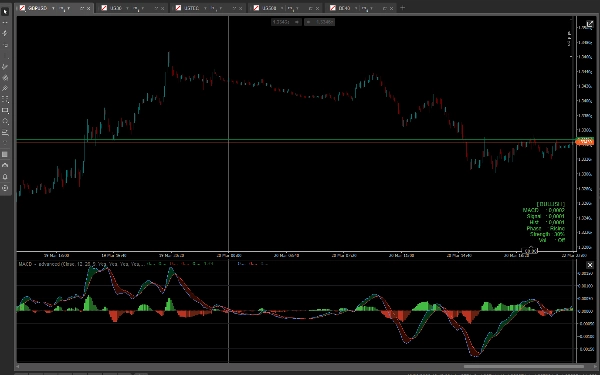
Opcjonalna chmura wypełnia obszar pomiędzy liniami MACD i Signal. Zielona chmura tworzy się, gdy MACD jest powyżej Signal (byczy sentyment), a czerwona, gdy MACD jest poniżej Signal (niedźwiedzi sentyment). Chmura daje natychmiastowy wizualny odczyt kierunku trendu na pierwszy rzut oka.
Siła trendu
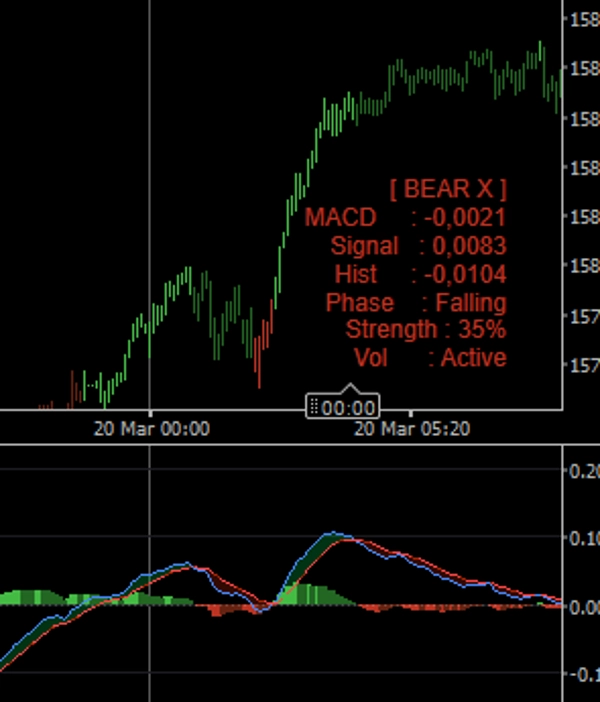
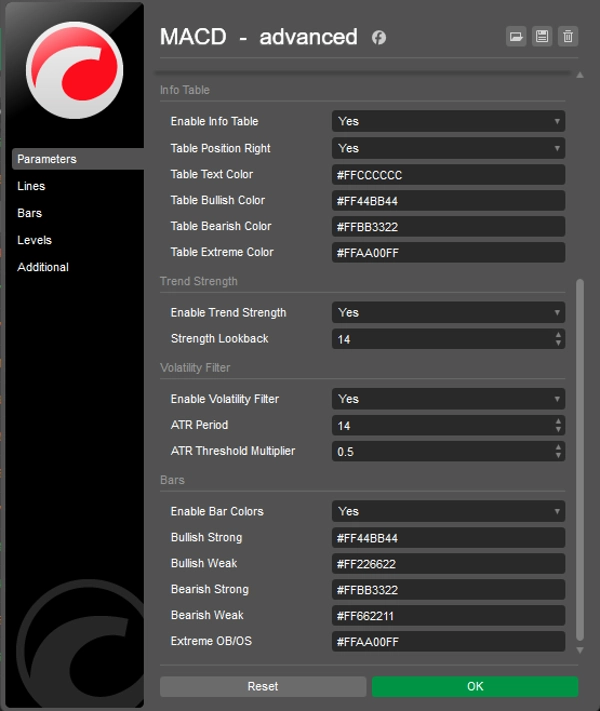
Wskaźnik oblicza w czasie rzeczywistym wynik siły trendu na podstawie odległości między liniami MACD i Signal w konfigurowalnym okresie wstecz. Wynik jest wyświetlany jako procent w tabeli informacyjnej, pomagając ocenić, jak silny lub słaby jest obecny ruch.
Filtr zmienności
Opcjonalny filtr zmienności oparty na ATR tłumi sygnały podczas okresów niskiej zmienności. Po włączeniu słupki histogramu i ich kolory zmieniają się na neutralny szary, gdy zmienność spada poniżej konfigurowalnego progu, zapobiegając fałszywym odczytom na spokojnych rynkach.
Tabela informacyjna
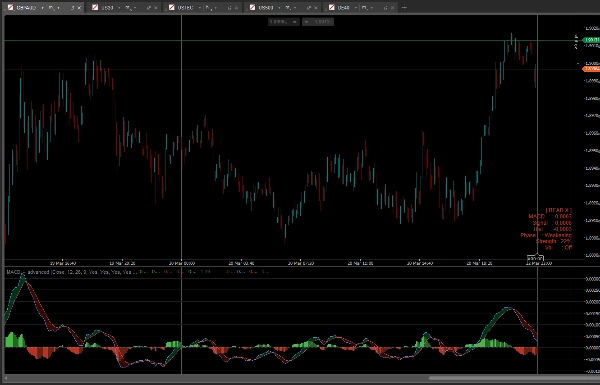
Kompaktowa tabela na wykresie wyświetla aktualny stan rynku (Byczy, Niedźwiedzi, Bycze przecięcie, Niedźwiedzie przecięcie, Neutralny), dokładne wartości MACD i Signal, wartość histogramu, fazę cyklu (Rosnąca, Słabnąca, Odzyskująca, Opadająca), procent siły trendu oraz status filtra zmienności. Pozycja tabeli (lewa lub prawa) oraz wszystkie kolory są w pełni konfigurowalne.
Kolorowanie słupków
Po włączeniu wskaźnik zmienia kolor świec na wykresie na podstawie warunków MACD: silny byczy, słaby byczy, słaby niedźwiedzi, silny niedźwiedzi oraz niska zmienność. Dzięki temu sygnał MACD jest bezpośrednio widoczny na wykresie cenowym bez przełączania paneli.
Podsumowanie kluczowych cech
- Czterokolorowy histogram momentum
- Chmura MACD między liniami MACD i Signal
- Wynik siły trendu w czasie rzeczywistym wyrażony w procentach
- Filtr zmienności oparty na ATR z wizualnym wsparciem
- Tabela informacyjna na wykresie z pełnym podziałem stanu rynku
- Opcjonalne kolorowanie świec na podstawie warunków MACD
- Wszystkie kolory w pełni konfigurowalne z obsługą kanału alfa
- Czysty i lekki — bez przerysowywania
Podsumowanie
Opinie klientów
5 | 33 % | |
4 | 67 % | |
3 | 0 % | |
2 | 0 % | |
1 | 0 % |


