
说明
概述
停止猜测市场方向。 EMA MTF 云图与仪表盘 是一套为短线交易者和日内交易者设计的全面趋势跟踪工具包。它将指数移动平均线的平滑性与多时间框架分析的强大功能结合在一个简洁的图表界面中。
不同于标准指标,该工具包含 智能中性区 逻辑,用于过滤震荡市场,帮助您避免在盘整期间收到错误信号。
主要特点
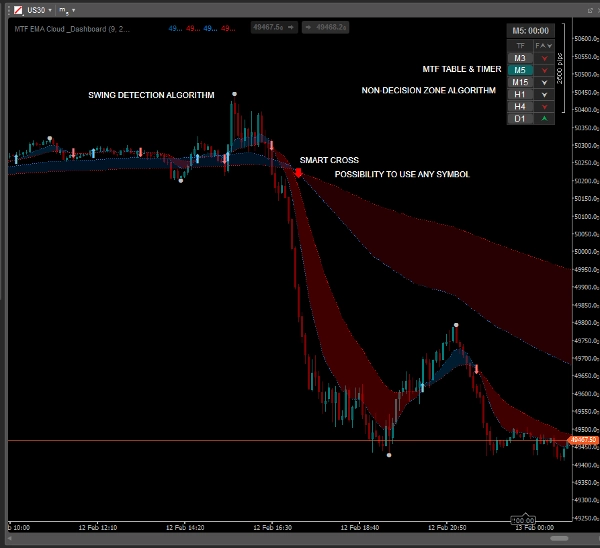
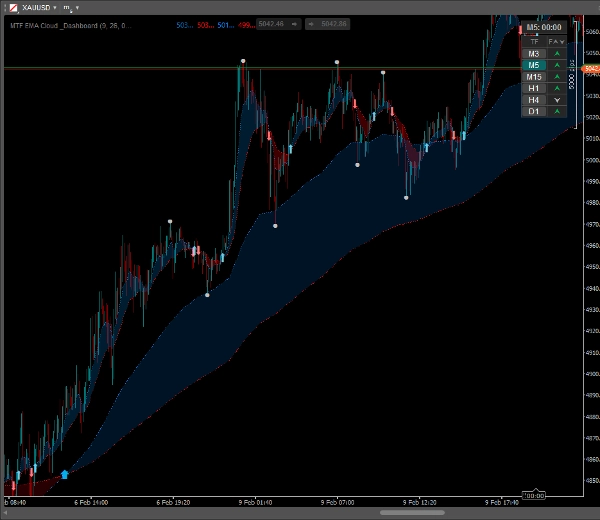
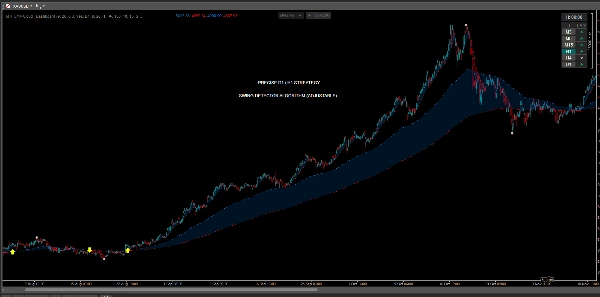
✅ 动态EMA云图
即时可视化趋势。快速和慢速EMA之间的空间用半透明云层填充,便于识别趋势强度及潜在支撑/阻力区域。
✅ MTF叠加(多时间框架)
无需切换图表即可查看“大局”。直接在较低时间框架图表(如M5)上显示较高时间框架的EMA(如H1)。
- 包含MTF趋势的独立交叉箭头!
✅ 智能趋势仪表盘
一个紧凑且可点击的表格,显示6个时间框架(M3至日线)的趋势状态。
- 中性区逻辑: 仪表盘检测盘整市场,并用灰色/银色标记,帮助您避免不良交易。
- 交互性: 点击表格中的任意时间框架按钮即可即时切换图表。
✅ 摆动高点/摆动低点
自动标记重要的局部高点和低点。非常适合设置 止损 订单或根据近期价格结构识别 获利 水平。
✅ 可视交叉信号
当快速EMA穿越慢速EMA时,清晰且可自定义的箭头会准确出现。
- 自定义颜色、大小和箭头样式。
✅ 蜡烛计时器
内置倒计时器准确显示蜡烛收盘剩余时间,对把握入场时机至关重要。
交易方法(策略示例)
- 检查仪表盘: 确保较高时间框架(如H1、H4)趋势一致(绿色/红色)。若显示“中性”(灰色),则避免交易。
- 等待信号: 寻找与主趋势方向一致的交叉箭头。
- 用价格行为确认: 利用“摆动高/低”点确认市场结构。
- 入场与管理: 在蜡烛收盘时入场。使用EMA云图作为动态支撑,跟踪止损。
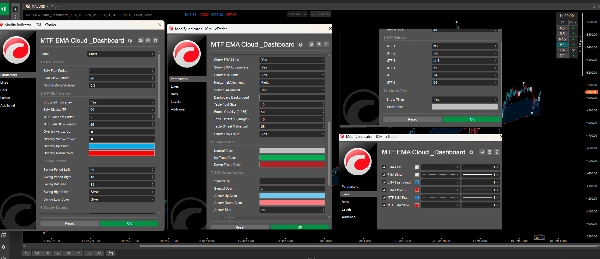
自定义设置
该指标高度可定制,以适应您的交易风格:
- 调整当前和MTF模式下的EMA周期。
- 更改云图、箭头、摆动点和仪表盘的颜色。
- 配置仪表盘的位置和透明度。
- 独立开关任何功能。
摘要
AI 摘要
EMA MTF TREND is a trading indicator designed for scalpers and day traders to analyze market trends using Exponential Moving Averages (EMA) combined with Multi-Timeframe (MTF) analysis. It features dynamic EMA clouds that visually represent trend strength and potential support/resistance zones by shading the area between fast and slow EMAs. The indicator overlays higher timeframe EMAs onto lower timeframe charts, allowing users to view broader market trends without switching charts.
A smart dashboard displays trend status across six timeframes (from 3 minutes to daily), incorporating a neutral zone logic that highlights flat or consolidating markets to help avoid false signals. The dashboard is interactive, enabling quick chart switching by clicking on timeframe buttons. The tool automatically marks swing high and low points to assist in setting stop loss and take profit levels based on recent price structure. Visual crossover arrows signal EMA fast and slow line crossovers, with customizable colors and styles. Additionally, a candle timer shows the remaining time until the current candle closes, aiding precise trade timing.
The indicator is highly customizable, allowing adjustments to EMA periods, colors, dashboard position, transparency, and feature toggling to fit individual trading styles. It supports markets including Forex, Crypto, and commodities like gold (XAUUSD), and is tagged for use with symbols such as BTCUSD and USDJPY.
指标配置
客户评价
4.0
评价:1
5 | 0 % | |
4 | 100 % | |
3 | 0 % | |
2 | 0 % | |
1 | 0 % |
客户评价
March 1, 2026
It becomes more useful when the setup needs a cleaner reason to exist. It can look better than it is during a lucky run.
讨论
常见问答
BTCUSD
Prop
Forex
Scalping
Supertrend
Crypto
AI
XAUUSD
USDJPY
cTrader Store 提供的所有产品,包括交易机器人、指标和插件,均由第三方开发者提供,仅供信息参考和技术访问之用。cTrader Store 并非经纪商,不提供投资建议、个人推荐或任何未来业绩保证。


价格
24
销售
662
免费安装