
Candles_Painter
Chỉ báo
3 lượt mua
Phiên bản 1.0, Aug 2025
Windows, Mac
5.0
Đánh giá: 2
Kể từ 26/05/2025
451.48M
Khối lượng đã giao dịch
61.16K
Pip đạt được
15
Lượt bán
1.44K
Cài đặt miễn phí
Mô tả
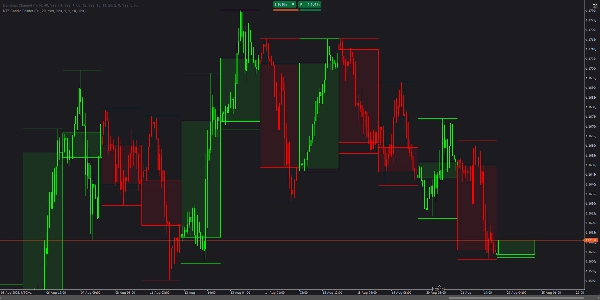
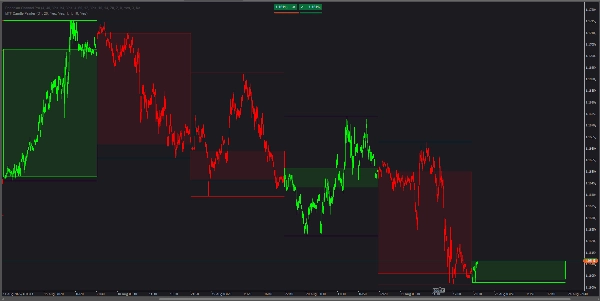
MTF Candle Painter phủ lên khung thời gian cao hơn (HTF) trực tiếp trên biểu đồ hiện tại của bạn. Nó tô màu từng thanh trên khung thời gian đang hoạt động theo hướng của cây nến HTF bao quanh và vẽ một hình chữ nhật thân nến HTF được tô đầy (chỉ mở–đóng, không có bóng nến) cùng với các đường đỉnh/đáy HTF tùy chọn. Màu sắc riêng biệt cho tăng/giảm và độ mờ điền có thể điều chỉnh giúp bạn dễ dàng nhận biết xu hướng chỉ trong nháy mắt.
Tính Năng Chính
- Tô màu thanh đa khung thời gian: tất cả các thanh bên trong một cây nến HTF kế thừa màu tăng/giảm của nó.
- Phủ thân nến HTF: hình chữ nhật giữa giá mở và đóng của HTF; không có bóng giữa để rõ ràng hơn.
- Phong cách riêng cho tăng/giảm: màu viền và màu điền độc lập cho các cây nến HTF tăng và giảm.
- Độ mờ có thể điều chỉnh: đặt độ trong suốt của phần điền (mặc định 10%) để xếp chồng gọn gàng với giá.
- Đường đỉnh/đáy HTF: tùy chọn, với độ dày có thể cấu hình.
- Kiểm soát nhìn lại: chọn số lượng cây nến HTF gần đây để hiển thị (mặc định 20).
- Nhẹ và nhanh: sử dụng đối tượng biểu đồ gốc; nhanh và không gây cản trở.
Tham Số
Cốt Lõi
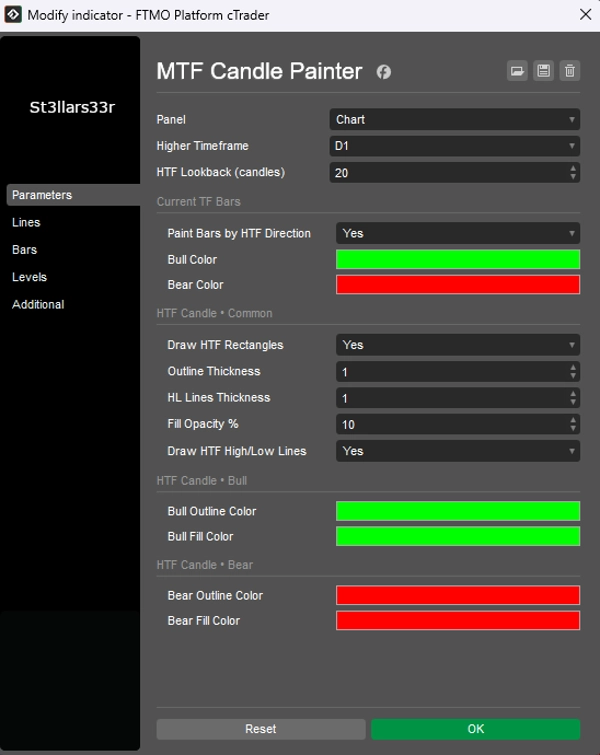
Khung Thời Gian Cao Hơn– HTF để phủ lên (ví dụ: D1, H4, W1).HTF Lookback (nến)– số lượng nến HTF để vẽ (mặc định 20).
Thanh TF Hiện Tại
Tô Thanh Theo Hướng HTF– tô màu thanh TF hiện tại theo cây nến HTF bao quanh (Có/Không).Màu Tăng/Màu Giảm– màu cho thanh TF hiện tại.
Nến HTF • Chung
Vẽ Hình Chữ Nhật HTF– hiển thị hình chữ nhật thân nến HTF (mặc định Có).Độ Dày Viền– độ dày viền thân nến HTF.Độ Dày Đường HL– độ dày của các đường đỉnh/đáy HTF.Độ Mờ Điền %– độ trong suốt của phần điền thân nến HTF (mặc định 10%).Vẽ Đường Đỉnh/Đáy HTF– bật/tắt các đường đỉnh/đáy HTF (Có/Không).
Nến HTF • Tăng
Màu Viền Tăng– màu viền cho các cây nến HTF tăng.Màu Điền Tăng– màu điền cho các cây nến HTF tăng.
Nến HTF • Giảm
Màu Viền Giảm– màu viền cho các cây nến HTF giảm.Màu Điền Giảm– màu điền cho các cây nến HTF giảm.
Dành Cho Ai
- Nhà giao dịch trong ngày và scalper cần xu hướng HTF liên tục mà không phải chuyển đổi biểu đồ.
- Người thực hành SMC/Wyckoff dựa vào cấu trúc khung thời gian cao hơn trong khi thực hiện trên các TF thấp hơn.
- Bất kỳ ai muốn một bối cảnh HTF trực quan, sạch sẽ được xếp lớp trên khung thời gian làm việc của họ.
Tóm tắt
Tóm tắt AI
Candles_Painter is a multi-timeframe indicator designed to overlay higher timeframe (HTF) candle context onto a lower timeframe chart. It visually colors each bar on the active timeframe according to the bullish or bearish direction of the enclosing HTF candle. The indicator draws filled rectangles representing the HTF candle bodies (open to close, excluding wicks) with customizable fill opacity and separate colors for bullish and bearish candles. Optional HTF high and low lines can also be displayed with adjustable thickness.
Key features include:
- Coloring of all bars within an HTF candle by its direction.
- HTF body overlays for clear visual bias.
- Independent styling for bullish and bearish HTF candles.
- Adjustable transparency for neat integration with price data.
- Configurable lookback period for the number of HTF candles shown.
- Lightweight implementation using native chart objects for performance.
Users can customize parameters such as the higher timeframe to overlay (e.g., daily, 4-hour), colors for bars and HTF candles, opacity, and whether to display HTF high/low lines. This tool is suited for intraday traders, scalpers, and market structure practitioners who require continuous HTF context without switching charts.
Hồ sơ chỉ báo
Đánh giá của khách hàng
5.0
Đánh giá: 2
5 | 100 % | |
4 | 0 % | |
3 | 0 % | |
2 | 0 % | |
1 | 0 % |
Đánh giá của khách hàng
September 1, 2025
The log becomes easier to read, but a manual check is still part of the process.
August 27, 2025
A few ugly trades are useful in the sample, and it makes the setup easier to question.
Thảo luận
Câu hỏi thường gặp
Các sản phẩm có sẵn trên cTrader Store, bao gồm bot giao dịch, chỉ báo và plugin, được cung cấp bởi các nhà phát triển bên thứ ba và chỉ nhằm mục đích cung cấp thông tin và tiếp cận kỹ thuật. cTrader Store không phải là nhà môi giới và không cung cấp lời khuyên đầu tư, khuyến nghị cá nhân hay bất kỳ đảm bảo nào về hiệu suất trong tương lai.


Giá
Kể từ 26/05/2025
451.48M
Khối lượng đã giao dịch
61.16K
Pip đạt được
15
Lượt bán
1.44K
Cài đặt miễn phí