
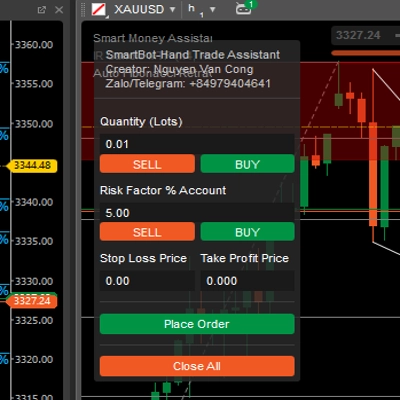
SmartBot-MCDX Indicator
Chỉ báo
1 lượt mua
Phiên bản 1.0, Feb 2025
Windows, Mac
4.0
Đánh giá: 2
Mô tả
🚀 Giới thiệu MCDX – Chỉ báo Giao dịch Thế hệ Mới! 🚀
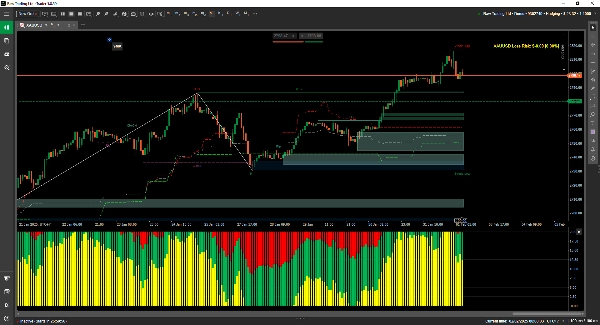
MCDX là một chỉ báo mạnh mẽ và sáng tạo được thiết kế để mang lại cho nhà giao dịch một lợi thế rõ ràng trên thị trường. Được xây dựng với các thuật toán tiên tiến, nó cung cấp tín hiệu chính xác cao để nhận diện xu hướng, sự thay đổi động lượng và các điểm vào/ra tối ưu.
🔥 Tại sao chọn MCDX? 🔥
✅ Nhận thức Giao dịch Độc đáo: Hiểu sâu hơn về các chuyển động của thị trường.
✅ Độ chính xác Nâng cao: Loại bỏ nhiễu và làm nổi bật các cơ hội giao dịch mạnh mẽ.
✅ Đa năng & Dễ sử dụng: Hoạt động mượt mà trên nhiều loại tài sản và khung thời gian khác nhau.
Nâng cấp chiến lược giao dịch của bạn ngay hôm nay với MCDX và nâng tầm phân tích thị trường của bạn lên một cấp độ mới! 📈🚀
Tóm tắt
Hồ sơ chỉ báo
Đánh giá của khách hàng
4.0
Đánh giá: 2
5 | 0 % | |
4 | 100 % | |
3 | 0 % | |
2 | 0 % | |
1 | 0 % |
Đánh giá của khách hàng
February 2, 2025
It adds another angle without taking control, but overconfidence is the real danger.
Thảo luận
Câu hỏi thường gặp
Các sản phẩm có sẵn trên cTrader Store, bao gồm bot giao dịch, chỉ báo và plugin, được cung cấp bởi các nhà phát triển bên thứ ba và chỉ nhằm mục đích cung cấp thông tin và tiếp cận kỹ thuật. cTrader Store không phải là nhà môi giới và không cung cấp lời khuyên đầu tư, khuyến nghị cá nhân hay bất kỳ đảm bảo nào về hiệu suất trong tương lai.


Giá
Kể từ 29/11/2024
32
Lượt bán
975
Cài đặt miễn phí