Mô tả
💡 Kênh Hồi Quy Tuyến Tính và Điểm ZigZag 💡
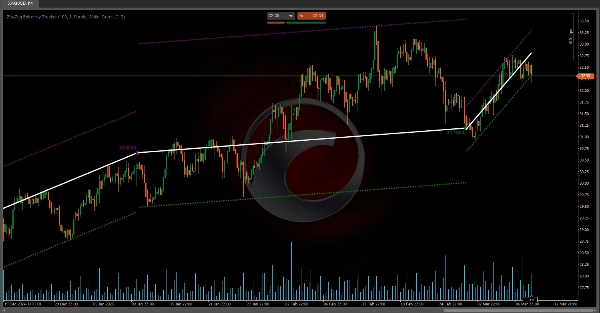
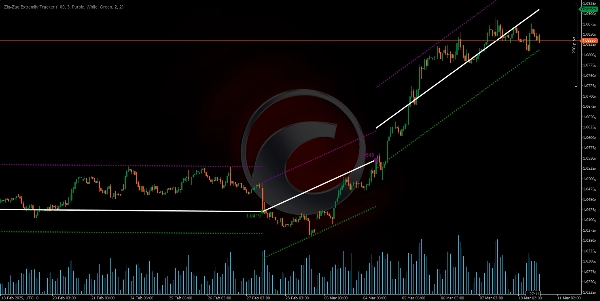
• Các kênh hồi quy tuyến tính được tính lại và đặt lại mỗi khi giá di chuyển vượt ra ngoài các giới hạn dự kiến (dải), đảm bảo phép đo luôn cập nhật với xu hướng thực của thị trường.
• Các điểm được đánh dấu (vòng tròn) đại diện cho các cực trị (đỉnh và đáy) làm cơ sở để vẽ ZigZag và xác định nơi các kênh được tính toán từ đó.
• Phương pháp động này cho phép hình dung tốt hơn các thay đổi tiềm năng của xu hướng, cũng như các vùng quá mức hoặc bán quá mức nơi giá có thể quay trở lại về trung bình.
❓ Các kênh liên quan như thế nào đến ZigZag và các điểm cực trị? ❓
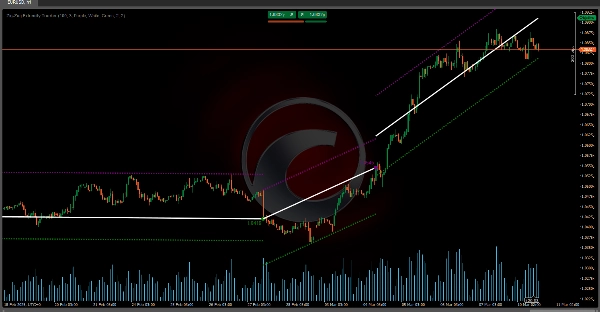
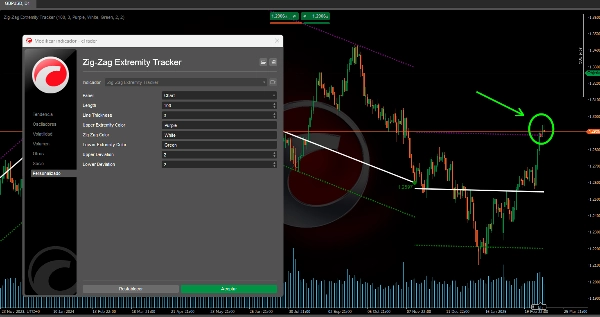
• Mỗi khi phát hiện một cực trị mới (đỉnh hoặc đáy), chỉ báo không chỉ vẽ một vòng tròn và đường ZigZag nối điểm đó với điểm trước đó, mà còn điều chỉnh lại kênh hồi quy tuyến tính tiềm năng được vẽ từ cực trị cuối cùng đó.
• Nếu trong các thanh tiếp theo, giá vẫn nằm trong các dải, kênh vẫn hoạt động và kéo dài đến thanh hiện tại.
• Nếu tại bất kỳ thời điểm nào giá phá vỡ các dải đó, chỉ báo “giả định” kênh đã bị vô hiệu và bắt đầu một kênh mới từ thanh nơi xảy ra sự phá vỡ.
Chỉ báo Ctrader Store:
Phiên Chênh Lệch Giá Trị Công Bằng
Cấu Trúc Thị Trường Động
Phân Tích Các Điểm Quay
Hồi Quy Tuyến Tính Fibonacci
Đa Khung Thời Gian
Khoảng Trống Giá Trị Công Bằng Động Lực
Định Hướng Nến Đa Cấp
Theo Dõi
Trình Theo Dõi Cực Trị Zig-Zag
Đường Hỗ Trợ và
Kháng Cự Xu Hướng Tự Động
Tất Cả Các Mức
Hỗ Trợ và Kháng Cự
Phân Tích Cấu Trúc Thị Trường Động của Các Điểm Quay
Hồi Quy Tuyến Tính Fibonacci Đa Khung Thời Gian
Theo Dõi Định Hướng Nến Đa Cấp
Đường Hỗ Trợ và Kháng Cự Xu Hướng Tự Động
Tóm tắt
Đánh giá của khách hàng
5 | 50 % | |
4 | 50 % | |
3 | 0 % | |
2 | 0 % | |
1 | 0 % |