
Mô tả
🧭 Định thời gian giao dịch của bạn theo đồng hồ: Atlas tiết lộ khi nào thị trường có xu hướng di chuyển theo tháng, ngày trong tuần và giờ. 🧭
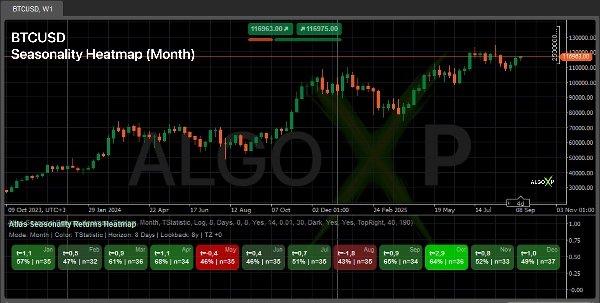
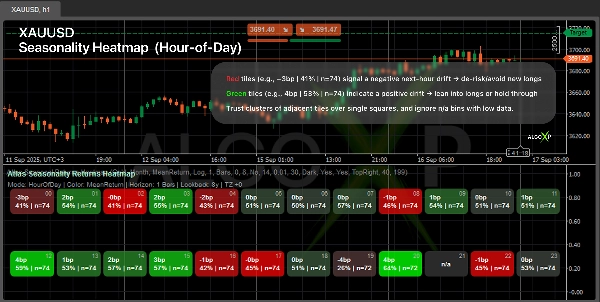
Xem khi nào thị trường của bạn có xu hướng di chuyển — theo Tháng, Ngày trong tuần hoặc Giờ trong ngày.
Atlas tính toán lợi nhuận tương lai trong một khoảng thời gian bạn chọn và vẽ một bản đồ nhiệt đối xứng (Xuống → Trung lập → Lên). Mỗi ô hiển thị một chỉ số (Trung bình, T-stat, hoặc Sharpe) cộng với tỷ lệ trúng% | n. Sử dụng nó để định thời điểm vào/ra, lên kế hoạch phiên giao dịch, và lọc rủi ro.
🎯 Tại sao các nhà giao dịch sử dụng nó
- Phát hiện các cửa sổ màu xanh lá để tham gia và các cửa sổ màu đỏ để đứng ngoài.
- Lên kế hoạch phiên giao dịch quanh giờ/ngày có lợi về mặt thống kê.
- Thêm một lớp “khi nào” rõ ràng cho các chiến lược tùy ý và hệ thống.
⚙️ Cách nó hoạt động
- Nhìn trước trong một khoảng thời gian bạn chọn và tóm tắt cách giá có xu hướng hành xử trong khoảng thời gian đó.
- Nhóm kết quả thành các khoảng thời gian (Tháng / Ngày trong tuần / Giờ) và tôn trọng múi giờ của bạn.
- Áp dụng bảo vệ chống ngoại lệ và một điểm sức mạnh vững chắc cho mỗi khoảng (cộng với kích thước mẫu).
- Vẽ một bản đồ nhiệt cân bằng quanh mức trung lập sử dụng màu Lên / Trung lập / Xuống của bạn.
👥 Dành cho ai
- Nhà giao dịch tùy ý — định thời điểm và kích thước tốt hơn theo phiên.
- Người xây dựng hệ thống & bot — một bộ lọc thời gian / kích thước thời gian cho các chiến lược.
- Nhà giao dịch tiền điện tử & chỉ số — các mẫu hành vi nhanh qua các ngày/giờ.
- Người mới bắt đầu — đọc đơn giản: xanh hơn = xu hướng tích cực hơn trong khoảng thời gian bạn chọn.
🚀 Bắt đầu nhanh
- Chọn Cài đặt Tài sản (Forex/Tiền điện tử/Chỉ số/Vàng).
- Đặt Khoảng thời gian (ví dụ, 1 Giờ cho HOD, 1 Ngày cho DOW/Tháng).
- Điều chỉnh Khoảng nhìn lại, Số quan sát tối thiểu, và màu sắc.
- Đọc các cụm (nhiều ô xanh/đỏ liền kề) để tìm tín hiệu mạnh nhất.
ℹ️ Tính mùa vụ không đảm bảo kết quả tương lai. Đó là một mẫu thống kê phụ thuộc vào khoảng thời gian và phương pháp luận. Sử dụng chỉ báo như bối cảnh cho các quy tắc vào/ra và quản lý rủi ro của bạn, kiểm tra độ bền qua nhiều cửa sổ nhìn lại, và tránh dựa vào các nhóm có n thấp (kích thước mẫu).
Tóm tắt
The indicator supports multiple asset presets including Forex, Crypto, Indices, and Commodities, and respects the user’s timezone. It applies outlier protection and calculates a robust strength score per time bucket to ensure reliable insights. Users can customize parameters like lookback period, minimum observations, and color schemes.
Atlas is suitable for discretionary traders seeking better timing and sizing, system and bot builders needing a time-based filter or sizing layer, crypto and index traders analyzing behavioral patterns, and beginners looking for a straightforward indication of positive or negative market bias. It provides a statistical context for entry/exit decisions and risk management but should be used alongside other analysis tools.
Đánh giá của khách hàng
5 | 50 % | |
4 | 50 % | |
3 | 0 % | |
2 | 0 % | |
1 | 0 % |


