
Описание
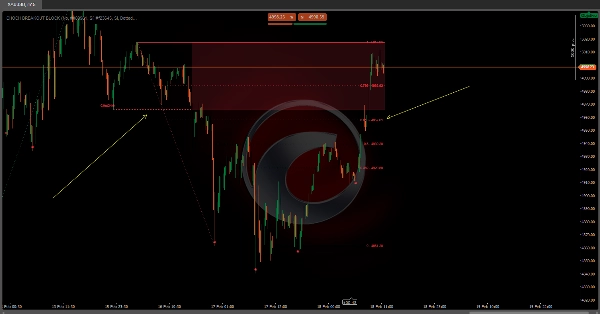
CHoCH Breakout Block
https://chartshots.spotware.com/c/69960085a796e
Этот индикатор предназначен для трейдеров, которые работают с Price Action и Smart Money Concepts (SMC) методологиями. Рекомендуемое использование:
- 🔍 Определите CHoCH как первый сигнал возможного структурного разворота.
- 👀 Наблюдайте за зоной интереса которая формируется: это область, куда цена обычно возвращается перед продолжением в новом направлении.
- ⏳ Дождитесь, когда цена вернется в зону и внутри нее ищите совпадение с уровнями Фибоначчи (особенно 0.382, 0.5, 0.618 и 0.786).
- ✅ Подтвердите с помощью поглощающей свечи (если в режиме StructureBased) внутри зоны для более точного входа.
- ❌ Сделка считается недействительной если цена нарушает противоположную границу зоны, так как индикатор в этот момент отменяет зону.
https://chartshots.spotware.com/c/699600271b05d
📊 1. Анализ трехуровневой структуры
Индикатор анализирует рынок на трех вложенных иерархических уровнях, от наименее до наиболее значимых:
- 🔹 Краткосрочный: Обнаруживает самые последние локальные максимумы и минимумы, сравнивая три последовательные свечи. Локальный минимум подтверждается, когда средняя свеча ниже предыдущей и следующей. Локальный максимум работает наоборот.
- 🔸 Среднесрочный: Построен на основе краткосрочных точек. Когда краткосрочные колебания формируют паттерн с понижением минимумов или повышением максимумов (три последовательных колебания подтверждают направление), устанавливается среднесрочная точка.
- 🔺 Долгосрочный: Построен точно так же, но используя среднесрочные точки в качестве основы. Это самый значимый уровень и тот, который запускает основные события индикатора.
💡 Такая каскадная структура обеспечивает, что сигналы генерируются только движениями с реальным структурным весом, отфильтровывая краткосрочный шум.
🔄 2. CHoCH — Изменение характера
CHoCH является центральным событием индикатора. Оно происходит, когда:
- 🟢 Бычий CHoCH: Цена закрывается выше предыдущего долгосрочного структурного максимума, в то время как предыдущее направление рынка было медвежьим. Это указывает на потерю контроля продавцами и возможный разворот рынка вверх.
- 🔴 Медвежий CHoCH: Цена закрывается ниже предыдущего долгосрочного структурного минимума, в то время как предыдущее направление было бычьим. Это указывает на потерю контроля покупателями и возможный разворот рынка вниз.
Когда обнаруживается CHoCH, индикатор рисует:
- ➡️ горизонтальную линию на точном уровне пробоя (с заданным стилем и толщиной)
- 🏷️ метку "CHoCH" над этой линией
- 🟥🟩 полупрозрачную зону интереса
🗺️ 3. Зона интереса
Сразу после CHoCH индикатор автоматически ограничивает ключевую ценовую зону:
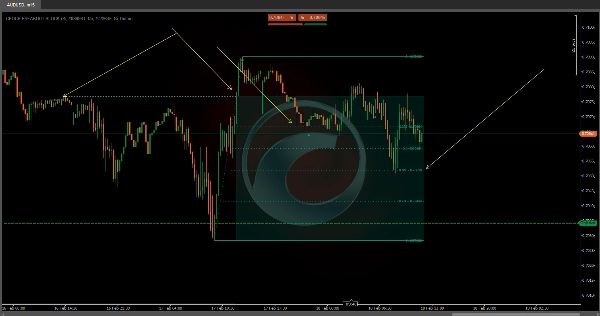
- 🟢 При бычьем CHoCH: Зона простирается от уровня пробоя (CHoCH) вниз до самой низкой точки, найденной между структурным колебанием и моментом пробоя. Эта зона представляет область, куда цена может вернуться, чтобы искать ликвидность перед продолжением роста.
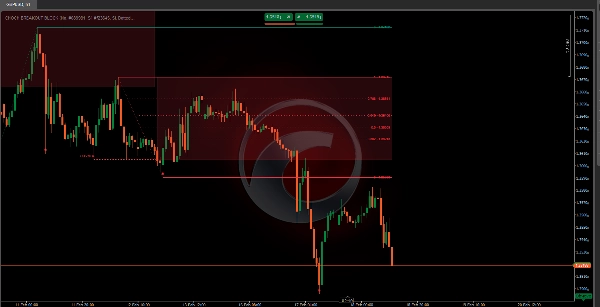
- 🔴 При медвежьем CHoCH: Зона простирается от самой высокой точки, найденной между колебанием и пробоем, вниз до уровня CHoCH. Она представляет область, куда цена может вернуться, чтобы искать ликвидность перед продолжением снижения.
Зона автоматически расширяется по барам до тех пор, пока цена уважает ее границы. В момент нарушения противоположной границы зона перестает расширяться — это указывает на то, что она была протестирована или отменена.
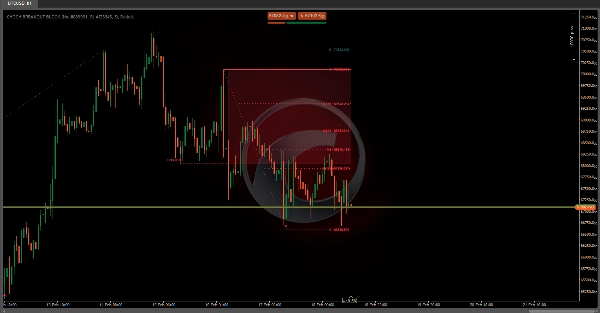
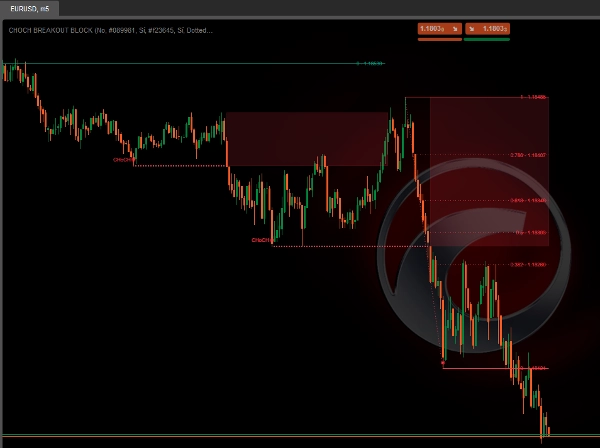
👁️ Как видно на изображении графика, полупрозрачные красные зоны представляют эти медвежьи зоны интереса после обнаруженных событий CHoCH.
📐 4. Автоматические уровни Фибоначчи
После обнаружения CHoCH индикатор НЕ рисует Фибоначчи сразу. Фибоначчи появляется на втором этапе, когда рынок подтверждает, что новое направление имеет реальный структурный вес. Это происходит в два шага:
Шаг 1 — Происходит CHoCH: 🏷️ Линия пробоя, метка и зона интереса нарисованы. Фибоначчи еще не видна.
Шаг 2 — Рынок формирует новое долгосрочное колебание в направлении CHoCH: 📐 Только в этот момент индикатор автоматически проецирует уровни Фибоначчи между точкой отсчета пробоя и этим недавно подтвержденным колебанием.
📌 Пример: При бычьем CHoCH Фибоначчи будет нарисована от самой низкой точки, найденной во время пробоя, до первого долгосрочного максимума, который рынок формирует после этого. Если цена растет, но еще не закрепила это структурное колебание, уровни Фибоначчи еще не будут видны — это сделано намеренно и не является ошибкой.
После активации уровни расширяются по барам, пока структура остается валидной, и автоматически пересчитываются если появляется новый структурный пробой. Доступные уровни:
Уровень
Общее значение
0
Начало движения
Небольшая коррекция
⭐ Первая значимая коррекция
0.5
⭐ Средний уровень
⭐ Золотое сечение
Вариант золотого сечения
⭐ Глубокая коррекция
1
100% расширение
🕯️ 5. Обнаружение поглощающей свечи
Индикатор включает обнаружение паттерна поглощающей свечи как дополнительный сигнал совпадения:
- ▲ Бычье поглощение появляется, когда большая зеленая свеча полностью поглощает предыдущую маленькую красную свечу.
- ▼ Медвежье поглощение появляется, когда большая красная свеча полностью поглощает предыдущую маленькую зеленую свечу.
Существует два режима отображения:
- 📋 Все: Показывает каждый паттерн поглощения, который появляется на графике.
- 🎯 StructureBased: Показывает только паттерны поглощения, которые происходят внутри активной зоны интереса, значительно повышая релевантность сигнала.
Сводка
When a CHoCH occurs, the indicator marks the breakout level with a horizontal line and label, and automatically creates a semi-transparent interest zone where price is likely to return before continuing in the new direction. This zone extends dynamically as long as price respects its boundaries and is invalidated if price breaks the opposite boundary.
The indicator also projects Fibonacci retracement levels automatically after the market confirms the new trend direction by forming a new long-term swing. Supported Fibonacci levels include 0.236, 0.382, 0.5, 0.618, 0.65, 0.786, and 1. Additionally, it detects bullish and bearish engulfing candle patterns as confluence signals, with options to display all patterns or only those occurring within active interest zones for higher precision.
This tool supports multiple markets including BTCUSD, EURUSD, GBPUSD, NZDUSD, XAUUSD, NAS100, and USDJPY.
Отзывы покупателей
5 | 100 % | |
4 | 0 % | |
3 | 0 % | |
2 | 0 % | |
1 | 0 % |


