
Описание
🚀 Более 10 000 трейдеров уже используют наши ЛУЧШИЕ индикаторы🏆
Узнайте, почему профессионалы выбирают нас – самые мощные инструменты на cTrader (индикаторы, алгоритмы и cBots) ждут вас.
👉 Получите все наши ЛУЧШИЕ системы здесь:
_______________________________________________
📌 Индикаторы структуры рынка
· ✅ AdvancedMarket Structure: Bos, Choch, SwinLevels, Order Blocks, Market Structure& Liquidity Finder
· 🔄 Dynamic Market StructureAnalysis of Turning Points
· 🧱 Order Block
· ⚖️ Market Imbalance
· ⛓️ BOS & CHOCH
· 🧠 ICT Power of 3
_______________________________________________
🔚 Системы умного выхода
_______________________________________________
📐 Индикаторы ZigZag
· 🔍 ZigZag Price LiquidityProjection
· ➖ ZigZag
· 🎯 Трекер экстремумов Zig-Zag
_______________________________________________
🧱 Индикаторы поддержки и сопротивления
· 🟩 SmartTrend линии поддержки и сопротивления
· 🧱 Все уровни поддержки и сопротивления
_______________________________________________
📊 Индикаторы тренда и каналов
· 🔄 Авто-тренд канал
· 📊 Супертренд
· 🌈 Динамический градиент тренда
· 🔁 Реактивная скользящая средняя
_______________________________________________
💧 Инструменты объема и ликвидности
· 📉 Карта ликвидаций с кредитным плечом
· 🔍 Разрыв справедливой стоимости Momentum
· 🕒 Сессии разрыва справедливой стоимости
_______________________________________________
⚡ Индикаторы Momentum и RSI
· 🚀 Динамический диапазон Momentum
· 🔎 Многоуровневый трекер свечного смещения
Tracker
_______________________________________________
🔮 Инструменты прогнозирования и проекции
· 📐 Прогноз на основе Linreg& ATR
· 📏 Фибоначчи линейная регрессияМультивременной
· 📈 Проектор рыночного потока на основе объема
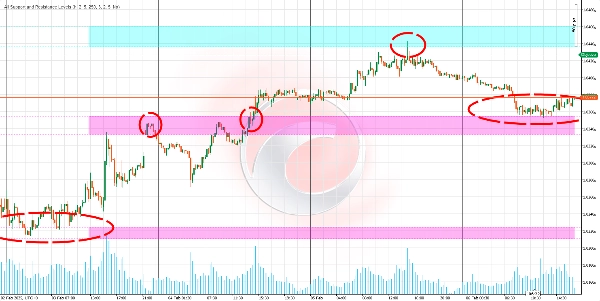
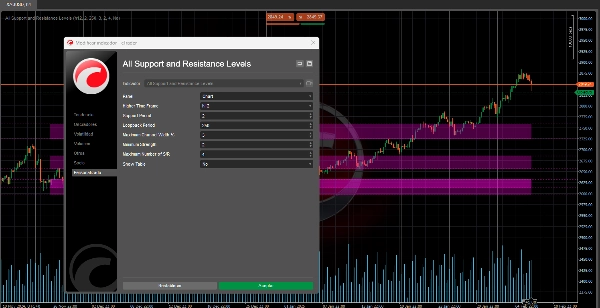
Этот алгоритм — продвинутый индикатор поддержки и сопротивления, предназначенный для помощи в выявлении ключевых уровней на рынке.
Его главное преимущество в том, что он позволяет видеть уровни поддержки и сопротивления с любого таймфрейма (например, дневного, недельного или месячного) прямо на графике, который вы анализируете, даже если он на другом таймфрейме (например, 15 минут или 1 час). 📊⏰
Для чего это нужно? 🎯
Определять ключевые рыночные зоны:
- Обнаруживать уровни, где цена может остановиться, отскочить или пробить с силой. 🛑↗️↘️
- Помогает принимать более обоснованные решения по входам, выходам и стоп-лоссам. 💡📈📉
Анализировать несколько таймфреймов без переключения графиков:
- Просматривать важные уровни с более высоких таймфреймов (например, дневного или недельного) при торговле на более низких (например, 15 минут или 1 час). 🕒📅
- Дает более широкий взгляд на рынок без постоянного переключения графиков. 🌍🔍
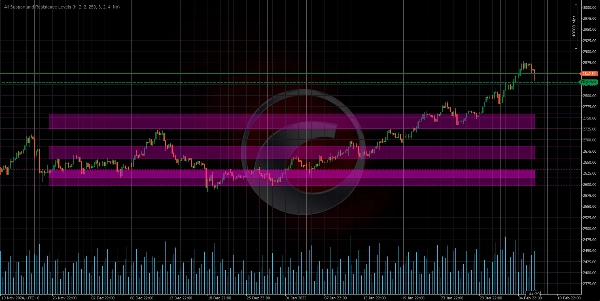
Приоритизировать значимые уровни:
- Индикатор ранжирует уровни поддержки и сопротивления по их «силе», то есть по тому, как часто цена взаимодействовала с ними в прошлом. 💪📊
- Это помогает сосредоточиться на самых релевантных и надежных уровнях. 🎯✅
Как работает логика? 🧠⚙️
Сбор данных:
- Индикатор берет максимумы и минимумы цен с определенного таймфрейма (дневного, недельного и т.д.). 📈📉
- Эти данные используются для поиска ключевых паттернов в поведении цены. 🔍📊
Обнаружение ключевых точек (пивотов):
- Определяет локальные максимумы и минимумы — точки, где цена достигла пика или впадины по сравнению с соседними значениями. ⛰️🌄
- Эти точки являются кандидатами на уровни поддержки или сопротивления. 🎯📌
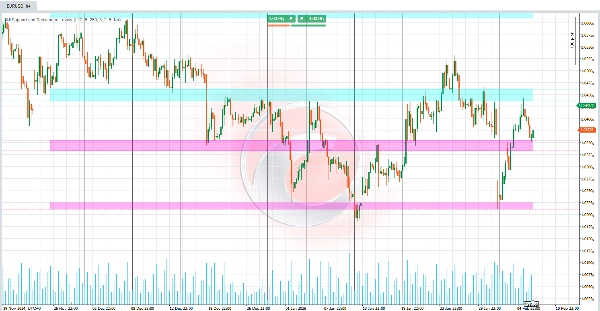
Группировка уровней:
- Близлежащие уровни группируются, формируя зоны поддержки или сопротивления, а не точные линии. 🟦🟧
- Это отражает идею, что поддержка и сопротивление — это области, а не точечные значения. 📏🎯
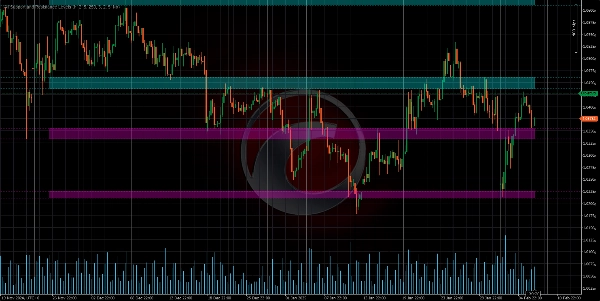
Расчет силы уровня:
«Сила» уровня определяется двумя факторами:
- Частота касаний: Сколько раз цена касалась или приближалась к этому уровню в прошлом. 🔄📊
- Кластеризация ключевых точек: Сколько максимумов или минимумов находится рядом с этим уровнем. 🔗📈
Уровни с большей силой считаются более значимыми. 💪🎯
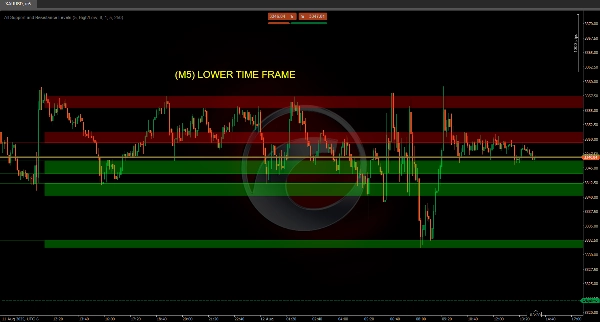
Визуализация на графике:
- Уровни отображаются в виде горизонтальных линий или цветных зон на графике. 🎨📊
- Цвет каждого уровня зависит от текущего положения цены:
-
- Сопротивление: Если цена ниже уровня. 🔴
- Поддержка: Если цена выше уровня. 🟢
- Внутри диапазона: Если цена находится внутри диапазона уровня. 🟡
Как просматривать разные таймфреймы на вашем графике? 🕒📊
Поддержка и сопротивление с более высоких таймфреймов на графиках с низким таймфреймом:
- Например, если вы анализируете 15-минутный график, индикатор может показать ключевые уровни с дневного или недельного таймфрейма. 🕒📅
- Это позволяет видеть важные уровни с более высоким контекстом, не покидая текущий график. 🌍🔍
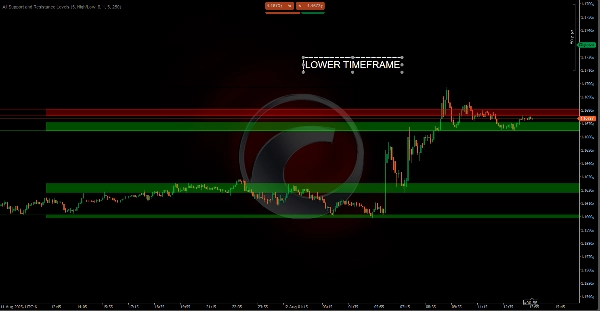
Поддержка и сопротивление с более низких таймфреймов на графиках с высоким таймфреймом:
- Хотя это встречается реже, вы также можете просматривать уровни с меньших таймфреймов (например, 1-минутного или 5-минутного) на графиках с более высоким таймфреймом (например, дневном или недельном). 🕒📅
- Это может быть полезно для более детального анализа в более широком контексте. 🔍📊
Сводка
The indicator analyzes price data by collecting highs and lows from specified timeframes, identifying local pivot points where price peaks or valleys occur. These points are grouped into zones representing support or resistance areas rather than precise lines. Each level is assigned a strength score based on the frequency of price touches and the clustering of key points, helping users prioritize the most significant and reliable levels.
Visualized on the chart as horizontal lines or colored zones, the indicator uses color coding to indicate the price's position relative to each level: red for resistance (price below level), green for support (price above level), and yellow when price is within the level’s range. This tool assists traders in making informed decisions on entries, exits, and stop-loss placements by highlighting where price may stop, bounce, or break with strength.
Отзывы покупателей
5 | 50 % | |
4 | 0 % | |
3 | 0 % | |
2 | 0 % | |
1 | 50 % |


