
Описание
Индикаторы Pinescriptlabs Store: Pinescriptlabs Store cBots : (cBot) Gold & BTC BreakoutSession Pivots(новый)
Advanced Market Structure: Bos, Choch, SwinLevels, Order Blocks, Market Structure & Liquidity Finder (Новый)
ZigZag Price Liquidity Projection
Trailing Smart Algorithm (новый)
Прогноз на основе Linreg & ATR
SmartTrend Support &
Resistance
Lines
Динамический
Анализ
Структуры Рынка
Поворотных
Точек
Фибоначчи
Линейная
Регрессия
Мульти-таймфрейм
Многоуровневый
Трекер Свечных Смещений
Tracker
Авто
Поддержка и
Сопротивление
Трендовые
Линии
Все
Уровни поддержки и
сопротивления
Уровни
Динамический Диапазон Моментума
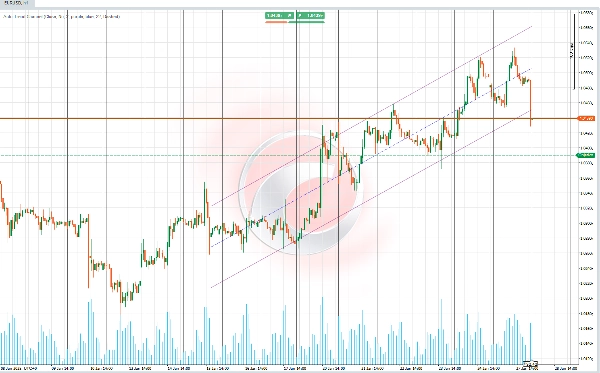
📊 Авто-Трендовый Канал 📊
Этот индикатор строит трендовый канал на основе вычисления линейной регрессии и стандартного отклонения ценовых данных (логарифмических) за автоматически выбранный период. 📈 Период определяется с использованием коэффициента корреляции Пирсона (RRR), выбирая тот, у которого наибольшее абсолютное значение. 🧮
✨ Основные функции ✨
Основная функция — вычислять трендовый канал, который автоматически адаптируется к наиболее представительной длине периода, используя продвинутую статистику для определения поддержки, сопротивления и центральной линии тренда.
Канал включает:
1️⃣ базовую линию, представляющую вычисленный линейный тренд.
2️⃣ верхние и нижние линии, определяющие границы канала на расстоянии, пропорциональном стандартному отклонению.
🚀 Особенности и вычисления 🚀
🔎 Оптимальный расчет периода
- Индикатор оценивает несколько периодов данных (коротких или длинных, в зависимости от конфигурации), чтобы найти тот, который имеет наиболее точную корреляцию с поведением рынка.
- В качестве ключевого показателя для определения периода с самой сильной связью между исторической ценой и построенной линией тренда используется корреляция Пирсона.
📐 Линейная регрессия и проекция цены
- Для каждого оцениваемого периода вычисляется линия регрессии на основе натурального логарифма цен для стабилизации экстремальных колебаний.
- Ключевые компоненты вычисления включают:
-
- Наклон: Представляет скорость изменения цены.
- Пересечение: Начальная точка проецируемой линии.
- Среднее: Устанавливает базовую линию для ориентира.
📊 Стандартное отклонение и границы канала
- Вычисляется стандартное отклонение цен относительно линии регрессии.
- Верхняя граница (сопротивление) и нижняя граница (поддержка) выводятся путем корректировки центральной линии с использованием множителя стандартного отклонения, настраиваемого пользователем.
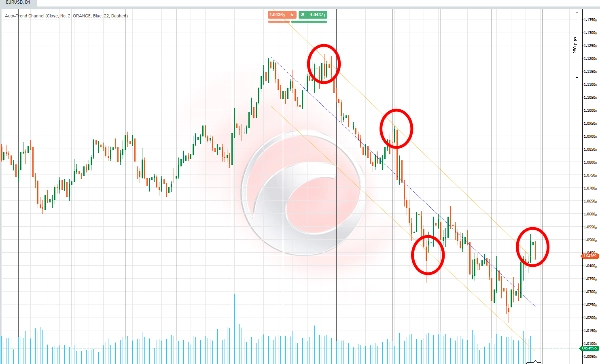
🌈 Визуализация трендового канала
- Канал состоит из трех основных элементов:
-
- Центральная линия: Показывает основной тренд на основе линии регрессии.
- Верхняя линия: Представляет верхнюю границу канала (сопротивление), скорректированную по стандартному отклонению.
- Нижняя линия: Представляет нижнюю границу канала (поддержка), скорректированную по стандартному отклонению.
- Пользователи могут настраивать цвета, прозрачность и стили линий канала для лучшей визуальной ясности.
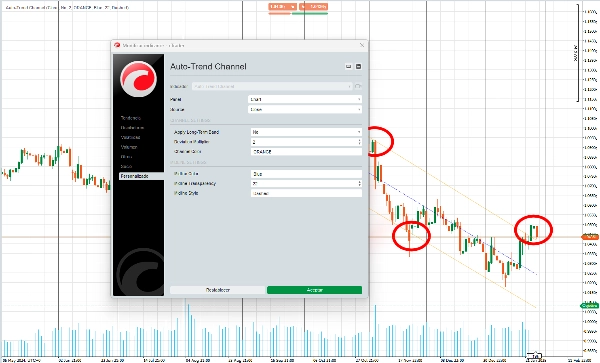
🎛️ Адаптивность и настройка
- Пользователи могут персонализировать различные аспекты индикатора, такие как:
-
- Цвета линий и канала.
- Фокус на длинных периодах (макро-тренды) или коротких периодах (микро-тренды).
- Эта адаптивность обеспечивает соответствие индикатора различным стилям торговли и визуальным предпочтениям.
🔍 Использование :
1️⃣ Идентификация тренда
- Центральная линия канала помогает определить, находится ли рынок в восходящем тренде, нисходящем тренде или флэте.
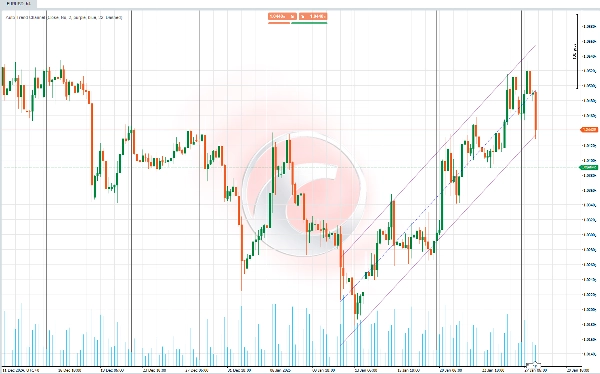
2️⃣ Динамическая поддержка и сопротивление
- Верхние и нижние линии канала служат потенциальными зонами, где цена может развернуться или консолидироваться.
3️⃣ Обнаружение консолидации и прорыва
- Если цены остаются внутри канала, это указывает на консолидацию, а прорыв — на смену тренда или сильное ценовое движение.
4️⃣ Адаптация к разным стилям торговли
- Длинные периоды полезны для определения общих трендов и принятия стратегических решений в более широких временных рамках.
- Короткие периоды позволяют трейдерам фиксировать быстрые движения и реагировать на мгновенные изменения рынка.
Сводка
Key features include:
- Optimal period selection by evaluating multiple data intervals to find the strongest correlation between historical prices and the trend line.
- Calculation of slope, intercept, and mean for precise linear regression and price projection.
- Visualization of the trend channel with customizable colors, transparency, and line styles.
- Adaptability for different trading styles by allowing focus on long-term (macro) or short-term (micro) trends.
Use cases:
- Identifying market trends (uptrend, downtrend, sideways) via the central trend line.
- Detecting dynamic support and resistance zones where price may reverse or consolidate.
- Recognizing consolidation phases within the channel and breakouts signaling trend changes or strong price movements.
- Adjusting analysis to suit strategic decisions or faster market responses depending on selected period length.
This indicator supports various markets including cryptocurrencies (BTCUSD), commodities (XAUUSD), and others, providing a statistical approach to trend and channel analysis.
Отзывы покупателей
5 | 60 % | |
4 | 20 % | |
3 | 20 % | |
2 | 0 % | |
1 | 0 % |


![Логотип продукта "High-Low Divergence [Iridio Capital]"](https://cdn.ctrader.com/image/webp/443c4661-7abb-40f1-842f-4b6ec560649b_40914)


