

Описание
Индикаторы Pinescriptlabs Store: Pinescriptlabs Store cBots : (cBot) Gold & BTC BreakoutSession Pivots(новинка)
Advanced Market Structure: Bos, Choch, SwinLevels, Order Blocks, Market Structure & Liquidity Finder (Новинка)
ZigZag Price Liquidity Projection
Trailing Smart Algorithm (новинка)
Prediction Based on Linreg & ATR
SmartTrend Support &
Resistance
Lines
Dynamic
Market Structure
Analysis
of
Turning
Points
Fibonacci
Linear
Regression
Multi-timeframe
Multi-Level
Candle Bias
Tracker
Auto
Support and
Resistance
Trend
Lines
All
Support and
Resistance
Levels
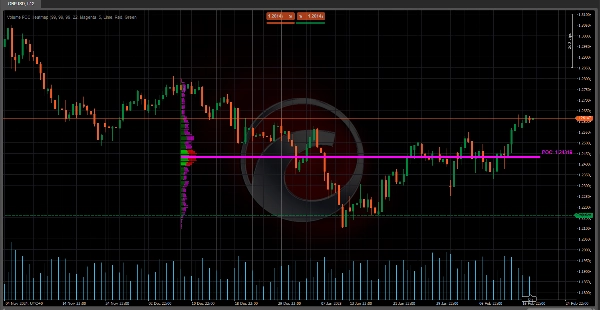
🔥 Volume POC Heatmap 🔥
Этот индикатор представляет собой Volume Profile (объемный профиль), который отображает распределение объема торгов по различным ценовым уровням за определенный период. Его основная цель — выявить ключевые зоны поддержки/сопротивления и области, где рынок проявил наибольший интерес (высокая активность покупок/продаж). Он очень полезен для:
- Определения точки контроля (POC) 🎯
Ценовой уровень с наибольшим объемом, который действует как магнит для ценового движения. - Визуализации зоны стоимости (VA)
Зона, где сосредоточен определенный процент от общего объема (например, 70%), указывающая на баланс между покупателями и продавцами. - Различения бычьего и медвежьего объема 📈📉
Показывает, где накапливается покупательская сила по сравнению с продавцами.
🧠 Основная логика и расчеты 🔢
- Деление ценового диапазона 📏
-
- Ценовой диапазон (от минимального до максимального за последние B Bars ) делится на Volume Cells (CNum) .
Пример: если CNum = 33 , диапазон разбивается на 33 равных уровня.
- Ценовой диапазон (от минимального до максимального за последние B Bars ) делится на Volume Cells (CNum) .
- Распределение объема по уровням 📊
-
- Для каждого бара в исторических данных:
-
- Вычисляется объем, связанный с телом (разница между открытием и закрытием) и тенями (максимумами и минимумами).
- Объем пропорционально распределяется по ценовым ячейкам, пересеченным баром.
Пример: если зеленый (бычий) бар охватывает 3 ячейки, объем в основном присваивается этим ячейкам как "бычий объем".
- Расчет точки контроля (POC) 🎯
-
- POC — это ячейка с наибольшим накопленным объемом, представляющая цену, где был достигнут наибольший консенсус между покупателями и продавцами.
- Расчет зоны стоимости (VA) 🔄
-
- Расширяется от POC вверх/вниз, пока не охватит заданный % от общего объема (например, 70%).
Пример: если VA варьируется от 100 до 105 , это означает, что 70% объема было совершено в этом диапазоне.
- Расширяется от POC вверх/вниз, пока не охватит заданный % от общего объема (например, 70%).
- Визуальная нормализация 🖼️
-
- Объемы масштабируются с помощью Scale Factor для регулировки ширины столбцов на графике, облегчая визуализацию.
🛠️ Ключ к Volume POC Heatmap 💡
- Отсутствие контекста в традиционных индикаторах объема 🤔
Классические индикаторы объема (например, объем по барам) не показывают, где именно был совершён объем. Этот индикатор отображает объем по ценовым уровням, решая эту проблему. - Органическое определение зон поддержки/сопротивления 🚀
Зоны с высоким объемом выступают как динамические уровни поддержки/сопротивления, более надежные, чем статичные линии. - Обнаружение дисбалансов ⚖️
Области с преобладанием бычьего или медвежьего объема сигнализируют о возможных прорывах или разворотах.
💡 Практическое применение в трейдинге 📈
- POC как зона интереса 🎯
-
- Если цена приближается к POC, ожидайте реакций, таких как отскоки или консолидации.
- Зона стоимости (VA) как зона баланса 🔄
-
- Если цена находится вне VA, она склонна возвращаться к ней (магнитный эффект).
- Если цена внутри VA, это может указывать на консолидацию.
- Бычий/медвежий объем как подтверждение 🔍
-
- Всплеск бычьего объема у сопротивления указывает на возможный прорыв.
- Высокий медвежий объем у поддержки сигнализирует о возможном пробое вниз.
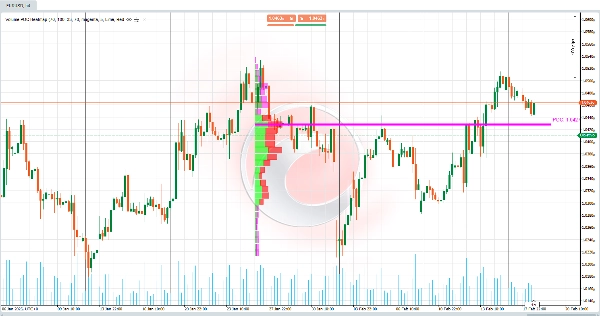
🌟 Пример 📊
Используемые параметры (видимые и настраиваемые пользователем):
- Bars Back = 55 → Количество анализируемых исторических баров.
- Volume Cells = 33 → Количество делений/ячееек в ценовом диапазоне.
- Value Area Volume % = 70 → Процент объема, определяющий зону стоимости.
Ситуация:
- Цена пробивает технический уровень поддержки, но объем в этой зоне низкий (согласно профилю).
- Позже цена возвращается в зону стоимости (VA) определенную 70% от общего объема.
Интерпретация:
- Прорыв оказался ложным (из-за низкого объема в зоне прорыва).
- Рынок стремится к ребалансировке внутри зоны стоимости , где активность выше (высокая плотность объема).
Действие:
- Ищите возможности для покупок возле нижней границы VA или POC, так как это зоны высокого интереса для участников рынка.
Сводка
Key functionalities include:
- Division of the price range into multiple volume cells for detailed volume mapping.
- Calculation of POC as the volume consensus price.
- Determination of the Value Area around the POC.
- Visual normalization of volume bars for clearer chart representation.
This tool addresses the limitation of traditional volume indicators by showing where volume was traded rather than just total volume per bar. It helps identify dynamic support and resistance zones based on volume concentration and detects volume imbalances that may signal potential breakouts or reversals. Traders can use it to anticipate price reactions near the POC and VA, aiding in decision-making for entries and exits. Configurable parameters include the number of historical bars analyzed, volume cells, and the percentage defining the Value Area.
Отзывы покупателей
5 | 100 % | |
4 | 0 % | |
3 | 0 % | |
2 | 0 % | |
1 | 0 % |


