
MARCs_MARKET_OVERVIEW_PRO
Indicateur
Version 1.0, Aug 2026
Windows, Mac
Trading product for MARCs_MARKET_OVERVIEW_PRO Indicateur Key Levels RSI, image 2
Trading product for MARCs_MARKET_OVERVIEW_PRO Indicateur Key Levels RSI, image 3
Trading product for MARCs_MARKET_OVERVIEW_PRO Indicateur Key Levels RSI, image 4
Trading product for MARCs_MARKET_OVERVIEW_PRO Indicateur Key Levels RSI, image 5
Trading product for MARCs_MARKET_OVERVIEW_PRO Indicateur Key Levels RSI, image 6
Trading product for MARCs_MARKET_OVERVIEW_PRO Indicateur Key Levels RSI, image 7
Trading product for MARCs_MARKET_OVERVIEW_PRO Indicateur Key Levels RSI, image 8
Trading product for MARCs_MARKET_OVERVIEW_PRO Indicateur Key Levels RSI, image 9
Trading product for MARCs_MARKET_OVERVIEW_PRO Indicateur Key Levels RSI, image 10
Depuis le 24/06/2026
1
Installations gratuites

Description

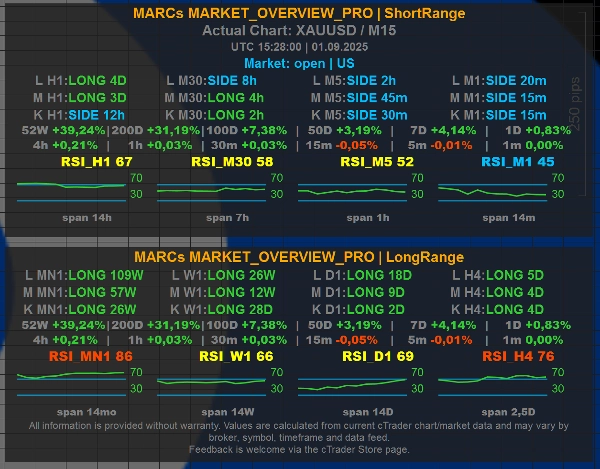
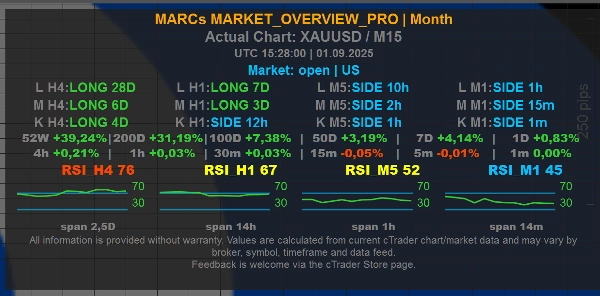
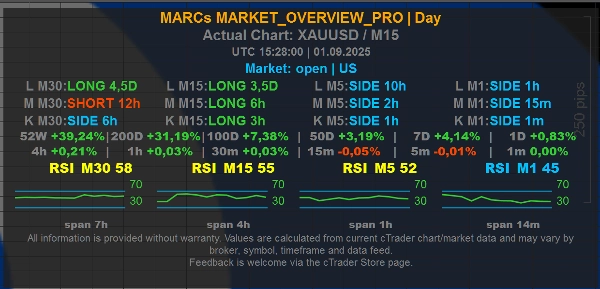
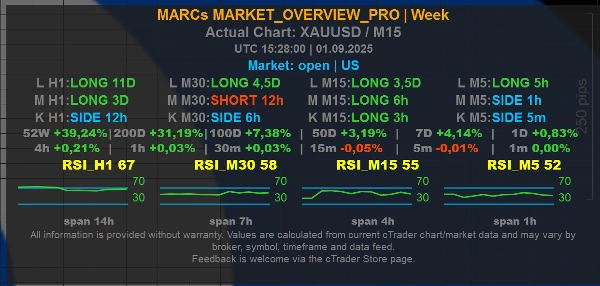
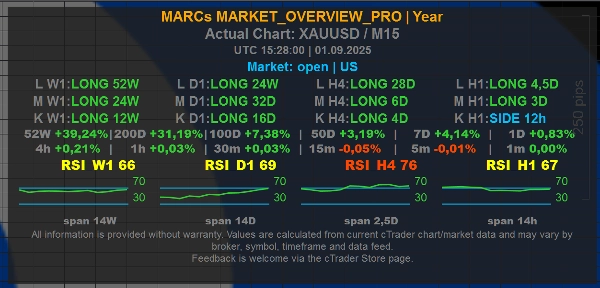
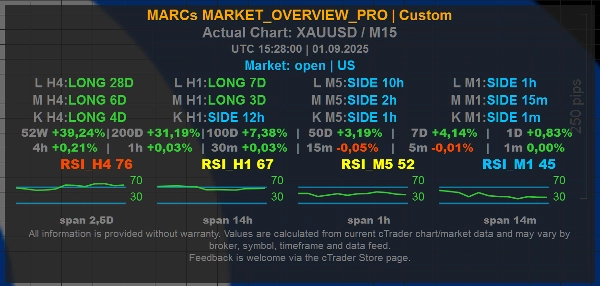
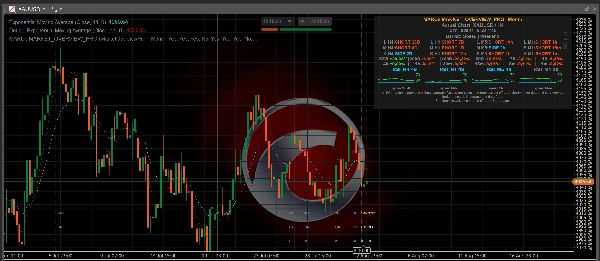
MARCs MARKET_OVERVIEW_Pro is a multi-timeframe market overview indicator for cTrader.


It displays a compact on-chart dashboard with trend context, RSI readings, market/session information and configurable time-horizon presets. The indicator was originally developed around XAUUSD / Gold analysis, but is designed to work as a general market overview tool on any available chart symbol, depending on broker data quality and available market history.


Main features:

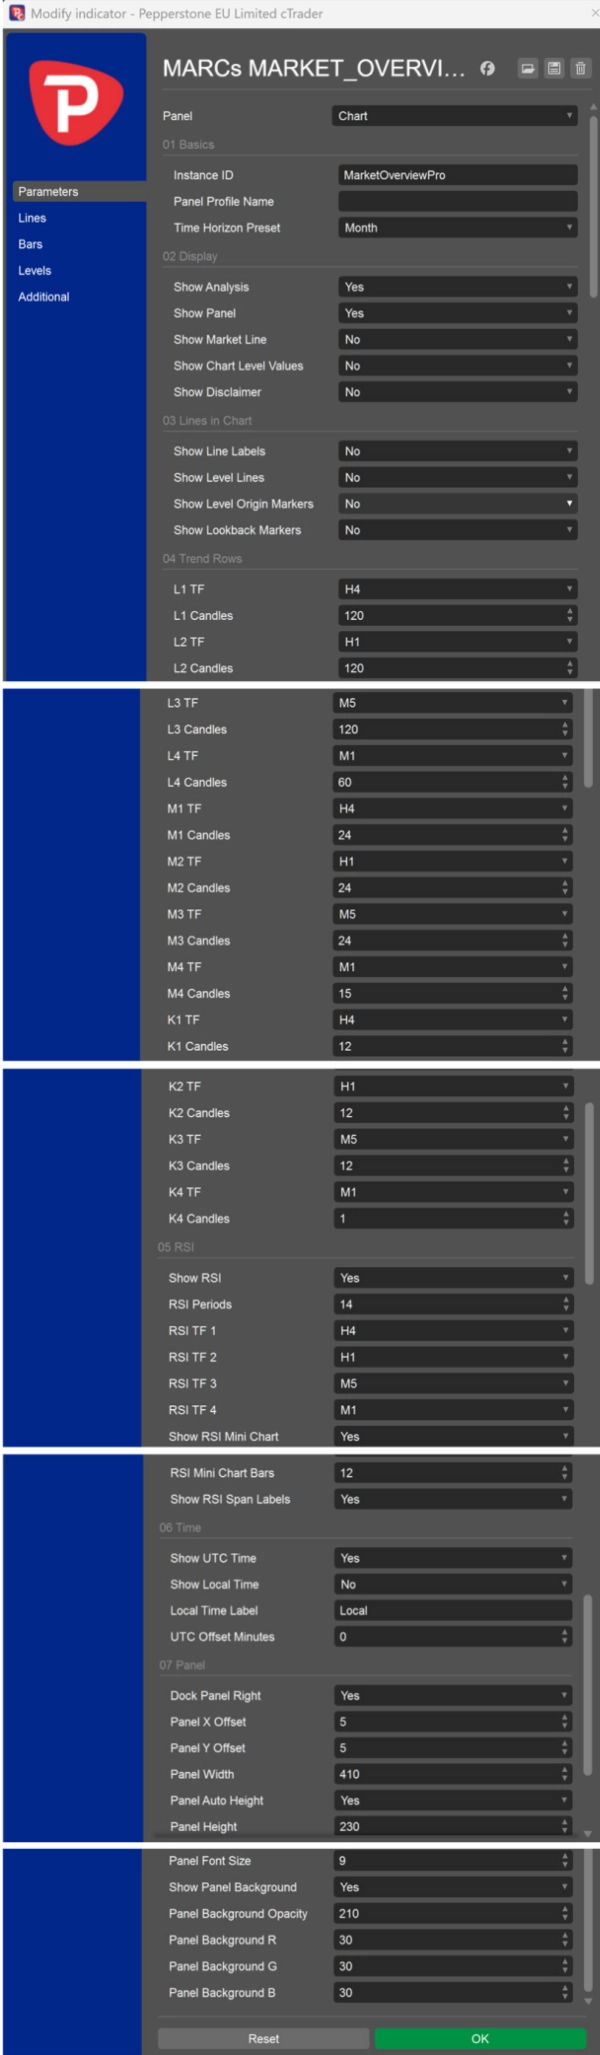
- Multi-timeframe trend rows for short, medium and long market context

- Configurable Day, Week, Month, Year, ShortRange, LongRange and Custom presets

- RSI values and mini RSI charts across selected timeframes

- Optional UTC and local time display

- Optional market/session line

- Optional chart-level reference lines

- Optional chart-level values shown directly in the panel


Level Lines and Chart Level Values:

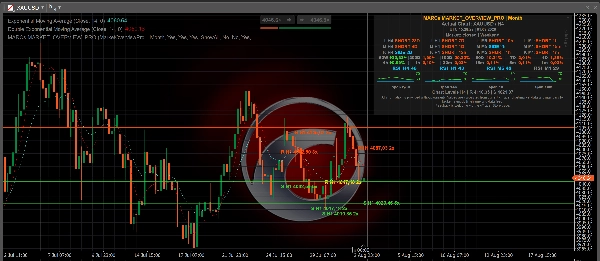
The optional Show Level Lines setting can display calculated chart reference levels from one selected timeframe: M1, M5, M15, M30, H1, H4, D1, W1 or MN1. For these individual timeframe selections, the indicator shows the nearest calculated resistance above the current price and the nearest calculated support below the current price. ShowAll displays the broader H1 level set from the existing H1 level calculation. No keeps level lines hidden.


The optional Show Chart Level Values setting can show the same nearest resistance/support reference values directly in the panel without drawing lines on the chart. The panel line is labelled, for example, "Chart Levels H1 | R ... | S ..." to make clear that the values refer to chart-level references.


How Level Lines are calculated:

The levels are derived from past swing highs and swing lows in the selected timeframe. Nearby swing points are grouped into level clusters, and only areas with enough repeated touches are shown. This makes the lines visual market-context markers based on available chart history.


Important:

MARCs Market Overview Pro is an analysis-only market overview tool. It does not place trades, manage positions, provide investment advice or guarantee trading results.


Level Lines are not buy signals, sell signals, stop-loss recommendations, take-profit recommendations or investment advice. They do not predict that price will reverse, break out or react at a specific level.


All readings depend on the available cTrader chart data, broker symbol feed, timeframe and market history. Values may differ between brokers, symbols and data feeds.


Trading involves risk. Past performance does not guarantee future results.

Résumé

Résumé IA
MARCs MARKET_OVERVIEW_Pro is a multi-timeframe market overview indicator designed for the cTrader platform. It provides a compact on-chart dashboard that displays trend context across short, medium, and long timeframes, RSI values with mini RSI charts, and market/session information. Users can configure time-horizon presets including Day, Week, Month, Year, ShortRange, LongRange, and Custom settings.
The indicator supports optional display of UTC and local times, market/session lines, and chart-level reference lines. These reference lines represent calculated support and resistance levels derived from clusters of past swing highs and lows on selected timeframes ranging from 1 minute to monthly intervals. Users can choose to show these levels as lines on the chart or as numeric values within the dashboard panel.
Originally developed with a focus on XAUUSD (Gold), MARCs MARKET_OVERVIEW_Pro is adaptable to any chart symbol supported by the broker’s data feed and market history. It serves as an analysis tool providing visual market structure and momentum insights but does not execute trades or offer trading advice. The indicator’s readings depend on the quality and availability of broker data and chart history.
Profil de l'indicateur
Catégorie de l'indicateur
Structure du marché (SMC)
Type de résultat
Visualisation
Filtre
Exigences en matière de données
Barres seulement
Signaux pris en charge
Puissance de la tendance
Atteinte du niveau

Avis clients

0.0
Avis : 0
Avis clients
Il n'y a pas encore d'avis sur ce produit. Vous l'avez déjà essayé ? Soyez le premier à en parler aux autres !

Discussion

Questions fréquentes

Key Levels
RSI
Market Structure
Risk Dashboard
Support & Resistance
Les produits disponibles sur cTrader Store, notamment les bots de trading, les indicateurs et les plug-ins, sont fournis par des développeurs tiers et mis à disposition à titre informatif et à des fins d'accès technique uniquement. cTrader Store n'est pas un courtier et ne fournit aucun conseil en investissement, aucune recommandation personnelle ni aucune garantie quant aux performances futures.

Plus de cet auteur

Indicateur
RSI
Key Levels
+3
MARKs Free XAUUSD market overview dashboard with trend rows, RSI context, sessions and fixed Day/Month presets.
cBot
Conservative
Fixed Risk %
+5
MARCs GOLD H4-Gold-Swing-Bot for XAUUSD with transparent long-term backtests and optional reserve/guard system.
3.01
Facteur de profit

Vous pourriez aussi aimer

Indicateur
ATR
Key Levels
+5
CPR indicator that actually predicts the day ahead: width percentile scoring for breakout-day detection
Indicateur
BOS
EMA
+5
Directional volume heatmap: see if a price zone was built on buying or selling, not just how much.
Indicateur
Prop
Forex
+5
Traders Panel: Scan 15 pairs across 5 timeframes. Live heatmap, strength rankings and best setups in one panel.
Indicateur
Customizable window inside your platform, access to any website Calendar
Indicateur
VWAP
Volume
+5
Institutional Session VWAP + 3-Sigma Bands & HUD. Engineered for high-precision Index & Prop Firm Scalping.
Indicateur
Forex
EURUSD
+4
A precision overlay tool that combines session-aware VWAP logic and standard deviations.
Indicateur
AI
ATR
+20
Algorithmic trend precision for cTrader.
Indicateur
BOS
MSS
+3
Orderblocks with Multi-Timeframe.
Indicateur
JMA-like is a highly responsive and ultra-smooth moving average designed to replicate the behavior of the original JMA!
Indicateur
Triangle
Double Top
+5
Know which liquidity sweeps are real. Auto-tracks EQH/EQL and confirms genuine reversals, not just broken levels.
Indicateur
SMC
Prop
+14
FVG Multi Time Frame Indicator
Indicateur
ATR
RSI
+5
Gold Emperor: AI-driven XAUUSD dominance. Dynamic pivots, matrix trend logic, and institutional shield protection.
Indicateur
Prop
Forex
+14
Stochastic Momentum Index (SMI) for cTrader optional higher-timeframe source, and clear overbought/oversold levels.
Indicateur
ATR
BOS
+4
Based on market structure and draws liquidity zones, institutional flows, and consolidation ranges. Smart Money Concepts
Indicateur
This indicator can be used to: change color, shape size, position, change font, increase or decrease, and other function
Indicateur
ATR
Prop
Outside Candle Detector: Highlights major candles/zones with ATR filter & pattern labels. By Avydel Talbo, prop trader.
Indicateur
Forex
Indices
+1
Professional Fair Value Gaps with multitimeframe spot on
Indicateur
Breakout
FlexSR auto‑detects pivot highs/lows to plot dynamic support & resistance lines Features customizable styling and option

Prix

Depuis le 24/06/2026
1
Installations gratuites


















