

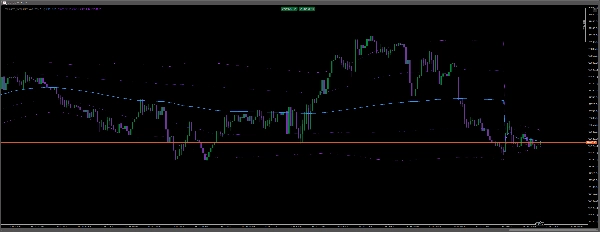
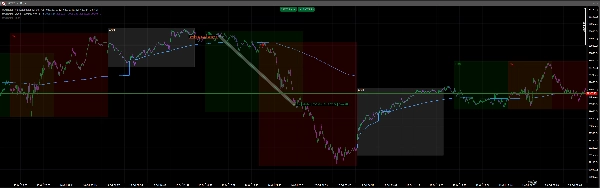
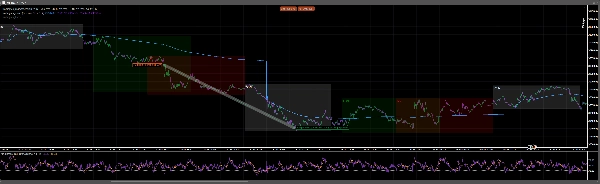
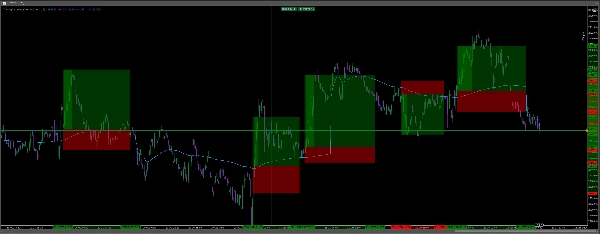
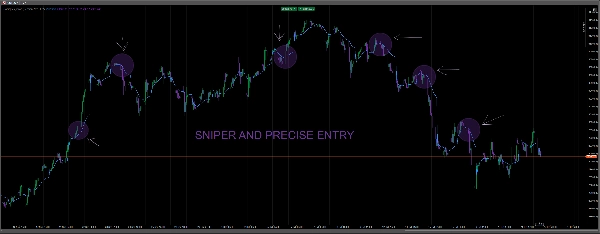
説明
- 🔵 青のVWAPライン: 取引量加重平均価格を表し、日中の市場方向や動的なサポートまたはレジスタンスを特定するのに役立ちます。
- 🟣 紫の偏差バンド: 価格が平均から離れた領域を強調表示し、トレーダーが過剰伸長や反転の可能性を特定するのに役立ちます。
- 📈 価格の拒否反応: ハイライトされたH1チャートは、VWAP周辺での価格反応が強気または弱気の動きに先行する様子を示しています。
⏰ 取引セッション: 別々のセッションオーバーレイでアジア、ロンドン、ニューヨークの取引時間を識別し、異なる市場状況での機会を評価するのに役立ちます。
----------------------------------
トレーダーが機会を見つけるのに役立つ方法
🟢 買いの機会: 価格がVWAPの上にとどまり、サポートとして再テストに成功した場合、トレーダーは強気の継続を狙うことができます。
🔴 売りの機会: 価格がVWAPの下で取引され、レジスタンスとして拒否された場合、トレーダーは弱気の継続の可能性を特定できます。
⚡ 精密スキャルピング: M1およびM5の時間枠で、VWAPは価格アクションとモメンタムの確認を用いて潜在的なエントリー、プルバック、エグジットを特定するのに役立ちます。
概要
AIによる概要
Tradingfcs_vwap is a technical indicator designed to assist traders in identifying intraday market trends and potential trade entries using the Volume Weighted Average Price (VWAP). It features a blue VWAP line that reflects the average trading price weighted by volume, serving as a dynamic support or resistance level. Purple deviation bands highlight price movements away from the VWAP, indicating possible overextensions and reversal points.
The indicator also visualizes price rejections on the hourly chart, showing how price interactions with the VWAP can signal bullish or bearish moves. Separate overlays mark the Asian, London, and New York trading sessions, enabling traders to assess market behavior across different periods.
Key trading signals include:
- Buy opportunities when price holds above VWAP and retests it as support.
- Sell opportunities when price trades below VWAP and rejects it as resistance.
- Precision scalping on 1- and 5-minute timeframes by identifying entries, pullbacks, and exits through price action and momentum confirmation.
This tool supports analysis based on volume, support and resistance, and trend strength, using bar data inputs and providing signal outputs for enhanced decision-making in various trading styles.
インジケーターのプロフィール
インジケーターのカテゴリー
サポート&レジスタンス
出力の種類
シグナル
データ要件
バーのみ
サポート対象のシグナル
トレンドの強さ
ディスカッション
カスタマーレビュー
0.0
レビュー: 0
カスタマーレビュー
この商品にはまだレビューがありません。お使いになったことがある方は、ぜひレビューをお願いします。
よくあるご質問
VWAP
Support & Resistance
cTrader Storeで入手可能な取引ボット、インジケーター、プラグインなどの商品は、第三者の開発者が提供するものであり、情報と技術の取得のみを目的としてご利用いただけます。cTrader Storeはブローカーではなく、投資助言や個人的な推奨を行うことも、将来のパフォーマンスを保証することもありません。










価格

登録日 05/07/2026
35.54M
取引数量
278.58K
獲得pips