
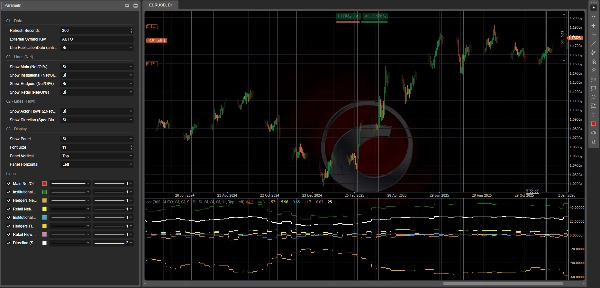
📊 COT Indicator History Pro — Actor Flow + Direction (Institutional / Hedgers / Retail)
CotIndicatorHistoryPro brings an advanced Commitments of Traders (COT) read directly onto your chart, with a clear breakdown by market participants (Institutional, Hedgers/Commercial, Retail).
It shows not only where each actor is positioned (predominantly long/short), but also what they are doing right now (increasing longs or shorts), plus a synthetic Direction line to highlight the prevailing bias.
The indicator loads its dataset from a secured JSON feed (HISTORY + OUTPUT) and aligns it safely on the chart (anti-lookahead option using PublicationDate).
🗓️ Weekly Data Update (Friday 21:00)
The COT dataset is updated every Friday at 21:00 (Europe/Rome time) thanks to a dedicated automation pipeline:
a sophisticated processing script performs the calculations and publishes the updated values to the JSON feed used by the indicator (and the related cBot ecosystem if installed).
✅ The indicator itself refreshes on-platform using your Refresh Seconds setting and will display the new weekly data as soon as it is published.
✅ What You Get (Lines + Panel)
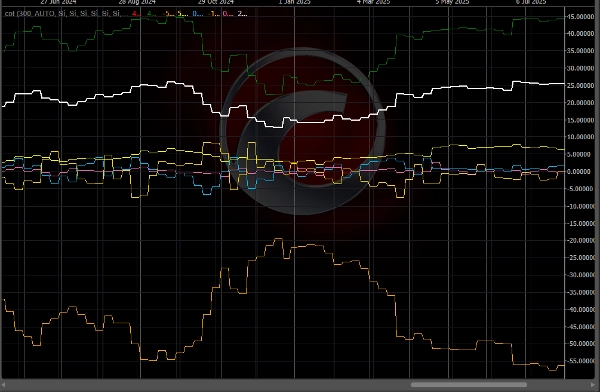
🔥 “Flow” Lines (3 Actors) — ΔNet/OI%
These lines represent the week-over-week change in Net positions, normalized by Open Interest:
- 🔵 Institutional Flow (ΔNet/OI%)
- 🟡 Hedgers / Commercial Flow (ΔNet/OI%)
- 💗 Retail Flow (ΔNet/OI%)
📌 How to read it:
- Above 0 ⇒ the actor is increasing Net LONG (adding longs and/or covering shorts)
- Below 0 ⇒ the actor is increasing Net SHORT (adding shorts and/or cutting longs)
- Larger absolute values (e.g., ±1.5%, ±3%) ⇒ stronger and more meaningful positioning changes
🧭 “Direction” Line — Spec Bias Net/OI%
- ⚪ Direction (Spec Bias) Net/OI% summarizes the prevailing “speculative” direction (average of Institutional + Retail, with fallback if needed).
📌 How to read it:
- > 0 ⇒ Speculative bias LONG
- < 0 ⇒ Speculative bias SHORT
- ≈ 0 ⇒ FLAT / neutral phase
🧩 Info Panel (Full Context)
A built-in panel displays:
- 📄 Report Date / Publication Date
- 📌 Open Interest + WoW (week-over-week) change
- 🎯 Text signal (if available in OUTPUT)
- For each actor:
- Bias (predominantly LONG / SHORT / FLAT) based on Net
- Net/OI%
- Flow (ΔNet/OI%)
- WoW ΔLong / ΔShort / ΔNet to understand how the position changed
🧠 How to Read It (Simple & Practical)
✅ Flow vs Bias (Key Difference)
- Flow = what they are doing now (adding longs or shorts)
- Bias = how they are positioned overall (predominantly long or short)
Example:
- Institutional Bias LONG + positive Flow ⇒ they are still pushing long
- Institutional Bias LONG + negative Flow ⇒ long reduction / possible rotation
🚦 Typical Trading Scenarios
✅ Scenario A — Trend Confirmation
- Direction > 0
- Institutional Flow > 0
➡️ Long pressure is consistent: often a continuation setup.
✅ Scenario B — Potential Reversal (Smart Money vs Retail)
- Institutional Flow > 0 while Retail Flow < 0
➡️ Retail sells/shorts while institutions buy: possible accumulation.
(Opposite = possible distribution)
✅ Scenario C — Hedgers as an “Alert”
- Hedgers at extreme levels (Net/OI far from neutral) + strong Flow
➡️ Possible excess zone / aggressive hedging (often better as a warning than a direct entry trigger).
✅ Scenario D — Market “Loading Up” (Breakout Risk)
- Strong Flow + Open Interest WoW rising
➡️ New positions are entering: probability of extended moves often increases.
⚡ 10-Second Reading Routine
- Check Direction: LONG (>0) or SHORT (<0)
- Check Institutional Flow: confirms or diverges?
- Check Retail Flow: confirms or does the opposite?
- Check Open Interest WoW: expansion or position unwinding?
✅ Supported Symbols + Key Legend (JSON Symbol Keys)
The indicator can analyze any instrument available in the JSON feed (field data[].symbol in OUTPUT).
How to select the correct instrument
- External Symbol Key = AUTO 👉 automatically uses the chart symbol (and removes any suffix after “.”, e.g.,
US2000.ecn→US2000). - If your broker uses different symbol names 👉 set External Symbol Key to the exact JSON key (case-insensitive).
Current keys in the feed (example snapshot: reportDate 2026-02-17, publicationDate 2026-02-20)
- FX:
AUDUSD,EURUSD,GBPUSD,USDMXN - Indices:
US100,US2000,DOW30,VIX - Commodities/Metals/Agriculture:
BRENT,WTI,COPPER,CORN,WHEAT,XAU(Gold),XAG(Silver) - Crypto:
BTC,ETH
📌 If you don’t see values on the chart:
- verify the chart symbol matches a JSON key
- set External Symbol Key manually (e.g.,
ETH,US2000) - check the panel Report/Publication Date to confirm the latest dataset loaded
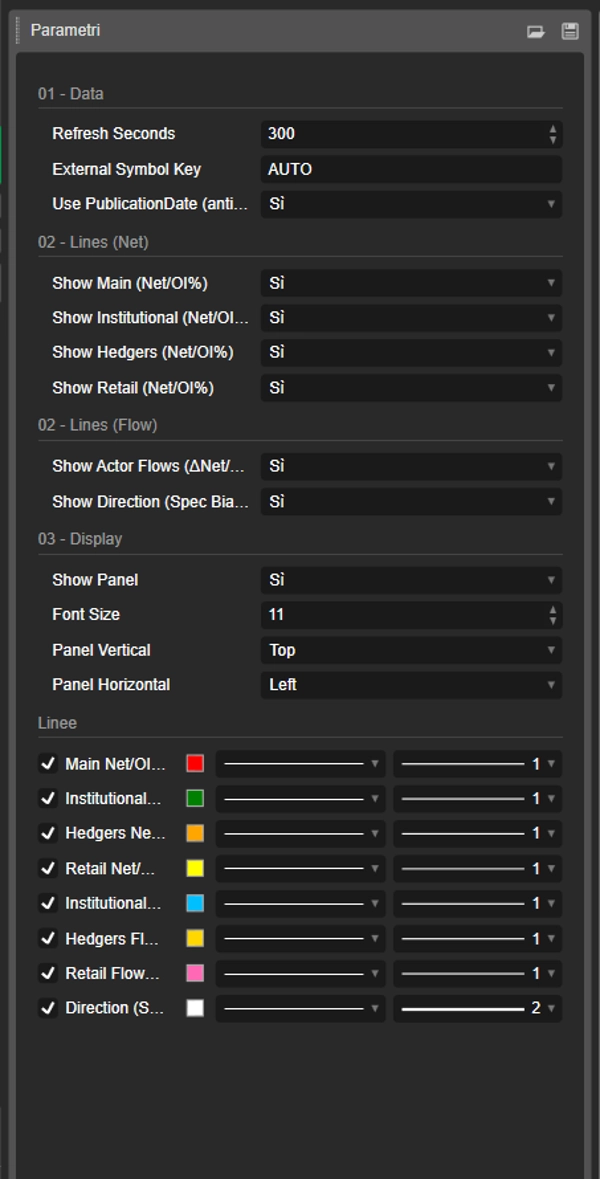
⚙️ Notes
- Supports safer alignment with Use PublicationDate (anti-lookahead) ✅
- Lines and panel can be enabled/disabled individually.
📌 Disclaimer: informational indicator only, not financial advice. COT data is weekly and should be contextualized with trend, key levels, and volatility.
5 | 50 % | |
4 | 50 % | |
3 | 0 % | |
2 | 0 % | |
1 | 0 % |


