
Side Volume Profile
Indicator
11 purchases
Version 1.0, Aug 2025
Windows, Mac
4.3
Reviews: 3
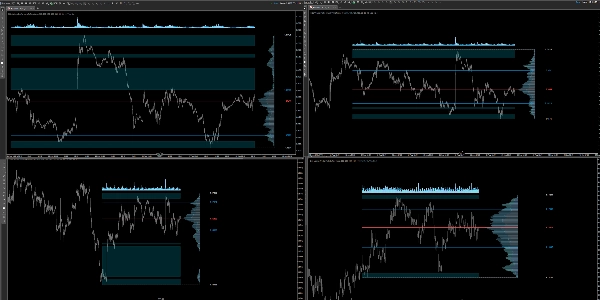
Description
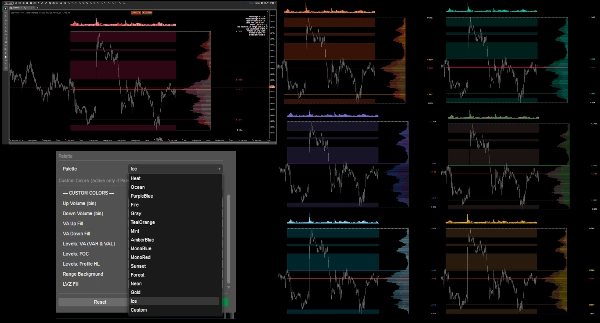
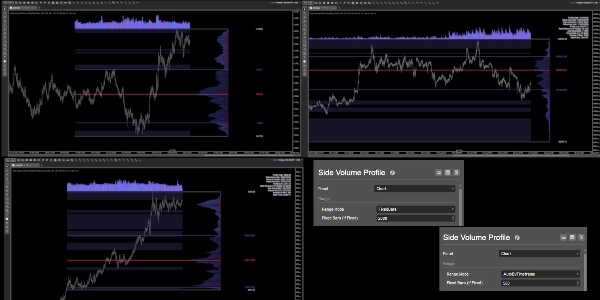
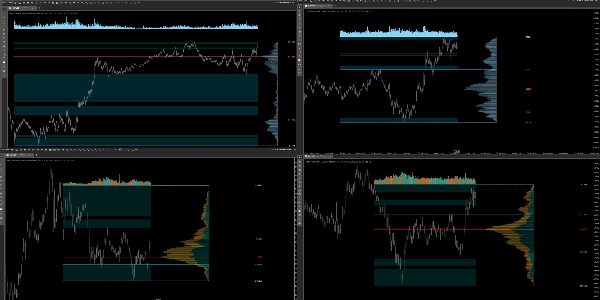
A right-side Volume Profile, that is always pinned to the last bars and doesn’t jump when you pan the chart. It computes volume-by-price over a chosen range (auto by timeframe or a fixed bar count), shows POC, VAH/VAL, profile bounds (High/Low), highlights low-volume zones (LVZ), and draws a volume histogram with EMA above the range (offset in pips). Includes a top-right stats panel, several high-contrast palettes plus custom colors, global bin opacity, width/offset controls, and per-line thickness/style. Built for readability and performance.
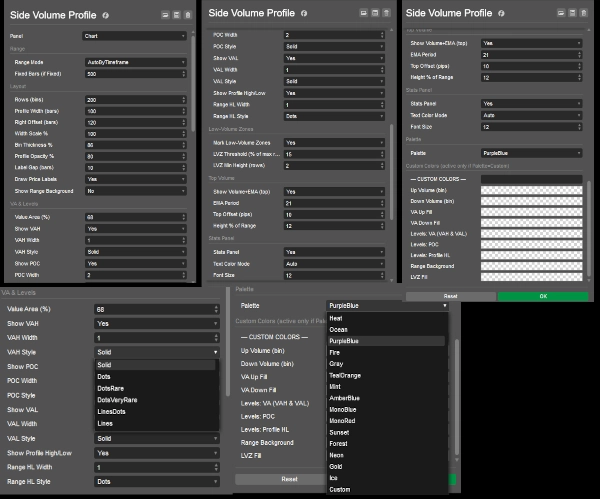
- Range: AutoByTimeframe or FixedBars.
- Layout: Rows (bins), Profile Width / Width Scale, Right Offset, Bin Thickness, Label Gap, profile opacity; optional range background.
- VA & Levels: Value Area %, toggle VAH/POC/VAL, per-level line width & style; profile High/Low.
- Low-Volume Zones: Threshold (% of max row) and minimum height (rows).
- Top Volume: EMA period, height (% of range), default offset 10 pips.
- Palette/Custom: Pick a theme or set your own colors (VAH = VAL).
- Stats Panel: Toggle, font size
Documentation of indicator
Summary
AI summary
Side Volume Profile is a right-anchored volume profile indicator designed for cTrader that displays volume-by-price data over a selectable range, either automatically by timeframe or a fixed number of bars. It visualizes key volume levels including Point of Control (POC), Value Area High (VAH), Value Area Low (VAL), and profile bounds (high/low). The indicator highlights low-volume zones (LVZ) based on configurable thresholds and minimum heights. It also features a volume histogram with an exponential moving average (EMA) offset in pips above the profile range.
Users can customize the layout with controls for row bins, profile width and scale, right offset, bin thickness, label gaps, and opacity. Line widths and styles for VAH, POC, VAL, and profile bounds are adjustable. Multiple high-contrast color palettes and custom color options are available. A toggleable top-right statistics panel provides summary data with adjustable font size.
The indicator supports various markets including Forex, indices, commodities, cryptocurrencies, and stocks, with tags referencing symbols like BTCUSD, EURUSD, GBPUSD, XAUUSD, NAS100, and USDJPY. It is built for readability and performance, maintaining a stable position on the chart without shifting when panning.
Indicator profile
Customer reviews
4.3
Reviews: 3
5 | 33 % | |
4 | 67 % | |
3 | 0 % | |
2 | 0 % | |
1 | 0 % |
Customer reviews
Discussion
FAQ
BTCUSD
Forex
Indices
EURUSD
Commodities
GBPUSD
NZDUSD
Prop
Fair Value Gap
SMC
Crypto
Stocks
XAUUSD
NAS100
USDJPY
VWAP
Products available through cTrader Store, including trading bots, indicators and plugins, are provided by third-party developers and made available for informational and technical access purposes only. cTrader Store is not a broker and does not provide investment advice, personal recommendations or any guarantee of future performance.


Price
Since 26/05/2025
385.09M
Traded volume
60.66K
Pips won
14
Sales
1.4K
Free installs