
Market Entropy
Indicator
107 downloads
Version 1.0, Aug 2025
Windows, Mac
Description
Market Entropy is a dual indicator (oscillator + optional price overlay) that quantifies market organization and flags regime shifts across Order → Transition → Chaos. It adds a second line, Trendness (DC), to separate true trend from volatility squeeze.
How it works:
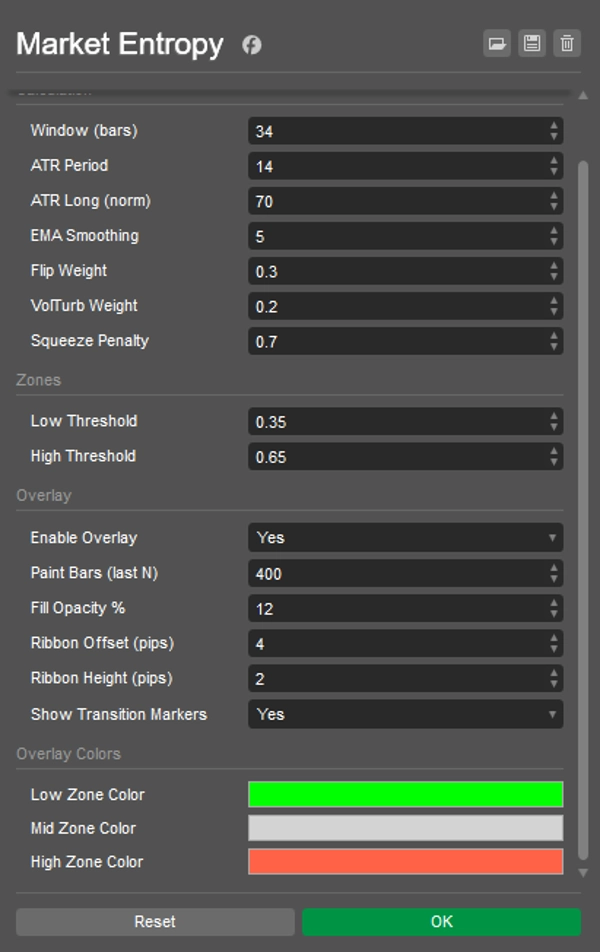
- Uses only OHLCV components: DC (directional consistency), FlipRate (sign flips), Volatility_n (ATR/ATRlong), VolumeTurb (stddev of ΔVolume).
- Raw entropy:
E0 = 0.5*(1-DC) + 0.3*(FlipRate*VolN) + 0.2*VolumeTurb). - Anti-squeeze term lowers E during ATR compressions → final Entropy ∈ [0..1] with EMA smoothing.
- Markers:
- CRYSTAL — cross below LowThr (order emerges: trend or pre-break squeeze).
- DISSOLVE — cross above HighThr (order breaks: chaos/trend decay).
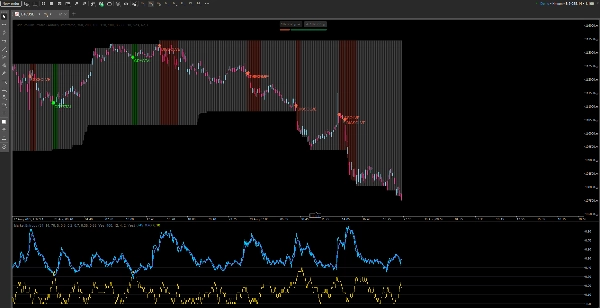
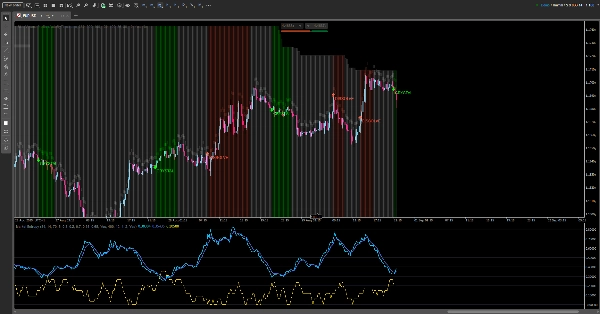
What you see:
- In the panel: Entropy, Entropy(EMA), Trendness (DC), Low/High thresholds, zone background.
- On chart (toggleable): state-colored bars, a slim ribbon above highs, and CRYSTAL/DISSOLVE markers.
Reading guide:
- E < LowThr → Order:
- with high DC → organized trend;
- with low ATR → squeeze (expect break).
- LowThr…HighThr → Transition: structure forming; wait for resolution.
- E > HighThr → Chaos: uncertainty / trend wear-off; avoid naive continuation entries.
Playbooks:
- Squeeze → CRYSTAL → Break/Retest — trade the breakout.
- Trend → DISSOLVE — scale out or tighten risk.
Summary
Indicator profile
Customer reviews
0.0
Reviews: 0
Customer reviews
No reviews for this product yet. Already tried it? Be the first to tell others!
Discussion
FAQ
Products available through cTrader Store, including trading bots, indicators and plugins, are provided by third-party developers and made available for informational and technical access purposes only. cTrader Store is not a broker and does not provide investment advice, personal recommendations or any guarantee of future performance.


Price
Since 26/05/2025
383.67M
Traded volume
60.66K
Pips won
14
Sales
1.39K
Free installs