
VolumeThermometer
Indicator
426 downloads
Version 1.0, Aug 2025
Windows, Mac
Description
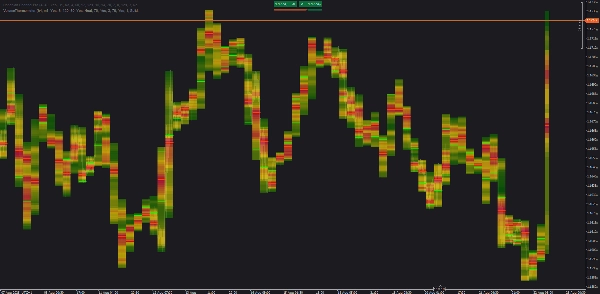
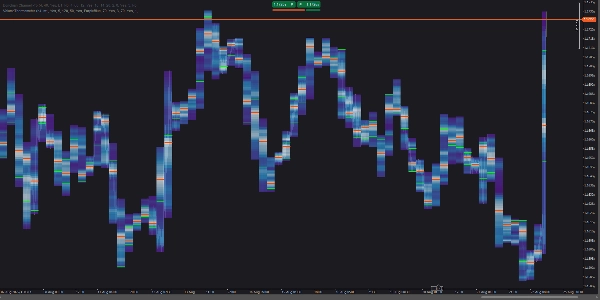
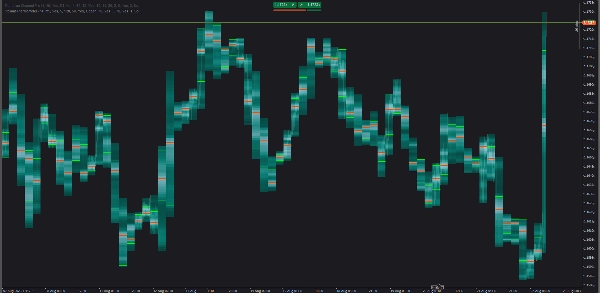
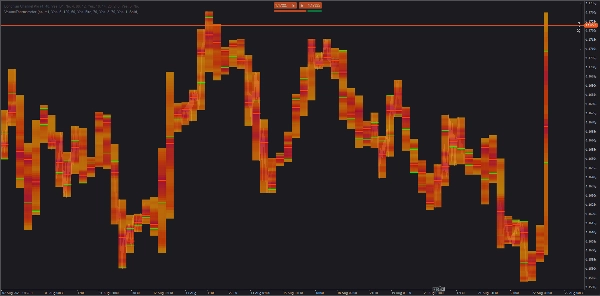
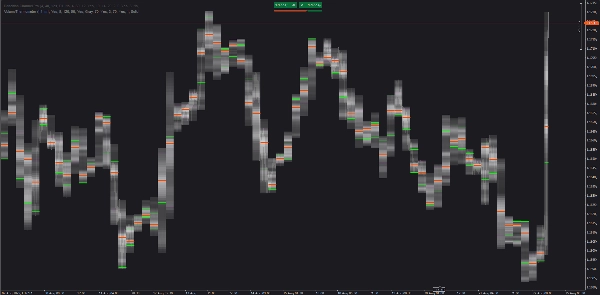
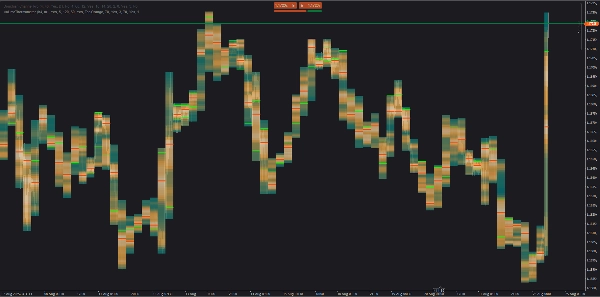
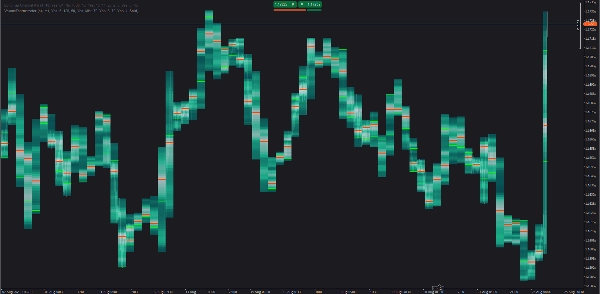
A cTrader heatmap that shows how volume is distributed inside each HTF candle. It uses LTF bars (e.g., M1) to build vertical volume bins, then draws POC and Value Area (VA) lines. The current (unfinished) HTF candle is painted in real time.
How it works
- Aggregates tick volume from LTF bars.
- Splits each HTF candle into
Binsprice slices and assigns volume by price overlap. - Colors bins by relative volume; draws POC, optional VA lines, and can extend them to the right.
- Auto-loads older history for the visible range only (small batches).
Use it
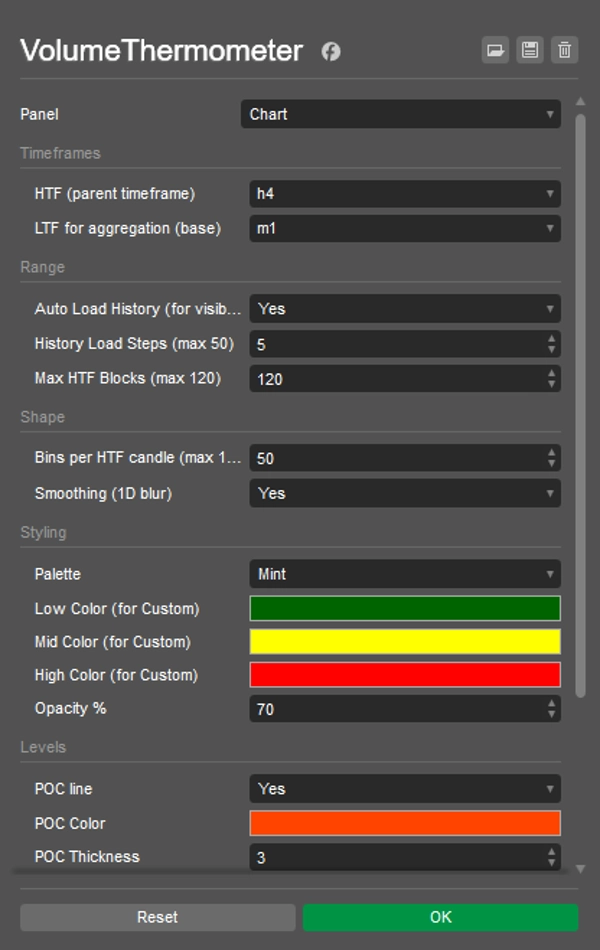
- Pick HTF (e.g., H4) and LTF (e.g., M1).
- Enable Auto Load History; scroll/zoom to the range you want.
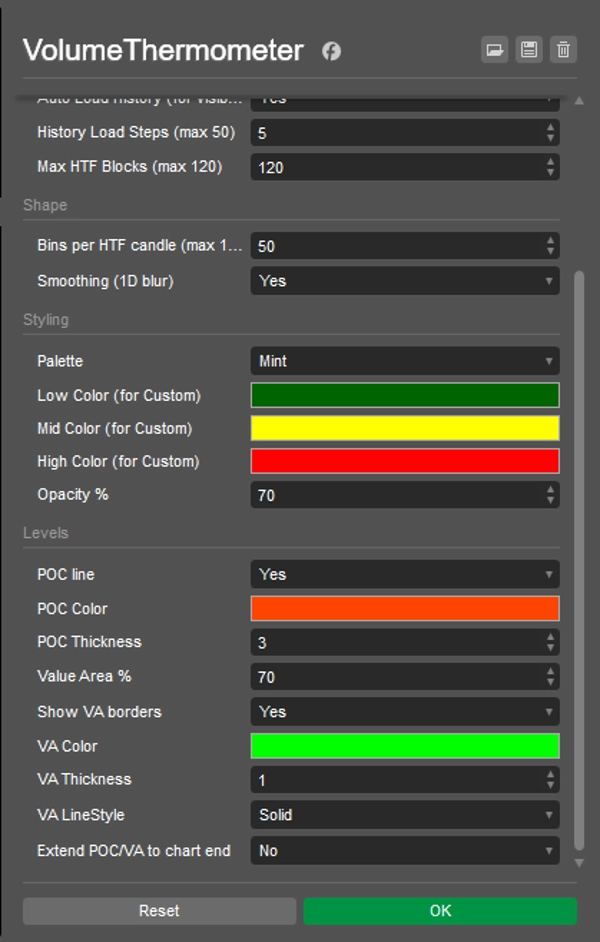
- Tune Bins (detail), Max HTF Blocks (how many candles to show), Smoothing, Opacity, and colors.
- Watch POC/VA reactions and how POC migrates candle to candle.
Quick ideas
- POC retest: first touch of prior POC with LTF confirmation.
- VA rotation: re-entry into VA often targets POC/other VA edge.
- LVN pass-through: thin (cold) areas tend to move fast to the next node.
Notes
- Uses tick volume (good proxy on FX/CFD, not exchange volume).
- For performance, reduce Bins or Max HTF Blocks if needed.
Summary
AI summary
VolumeThermometer is a cTrader indicator that visualizes intra-higher timeframe (HTF) volume distribution using a heatmap. It aggregates tick volume data from lower timeframe (LTF) bars (e.g., M1) to construct vertical volume bins within each HTF candle (e.g., H4). The indicator highlights the Point of Control (POC) and Value Area (VA) lines, showing where the most volume is concentrated by price level. The current HTF candle is updated in real time, and the indicator automatically loads historical data for the visible chart range in small batches to optimize performance.
Key features include:
- Aggregation of tick volume from LTF bars.
- Division of HTF candles into price bins with volume assigned by price overlap.
- Color-coded volume bins indicating relative volume intensity.
- Display of POC and optional VA lines, with the ability to extend these lines forward.
- Customizable settings for bin detail, maximum HTF candles displayed, smoothing, opacity, and colors.
- Supports multiple markets including Forex, indices, commodities, stocks, and cryptocurrencies such as BTCUSD and EURUSD.
Users can monitor POC retests, VA rotations, and low volume node pass-throughs to analyze volume behavior within HTF candles. The indicator uses tick volume as a proxy, suitable for FX and CFD markets.
Indicator profile
Customer reviews
0.0
Reviews: 0
Customer reviews
No reviews for this product yet. Already tried it? Be the first to tell others!
Discussion
FAQ
BTCUSD
Prop
Forex
Indices
EURUSD
Commodities
Crypto
Stocks
NAS100
Products available through cTrader Store, including trading bots, indicators and plugins, are provided by third-party developers and made available for informational and technical access purposes only. cTrader Store is not a broker and does not provide investment advice, personal recommendations or any guarantee of future performance.


Price
Since 26/05/2025
449.3M
Traded volume
61.1K
Pips won
15
Sales
1.43K
Free installs