
Moving Average Plus
Indicator
142 downloads
Version 1.0, Aug 2025
Windows, Mac
Description
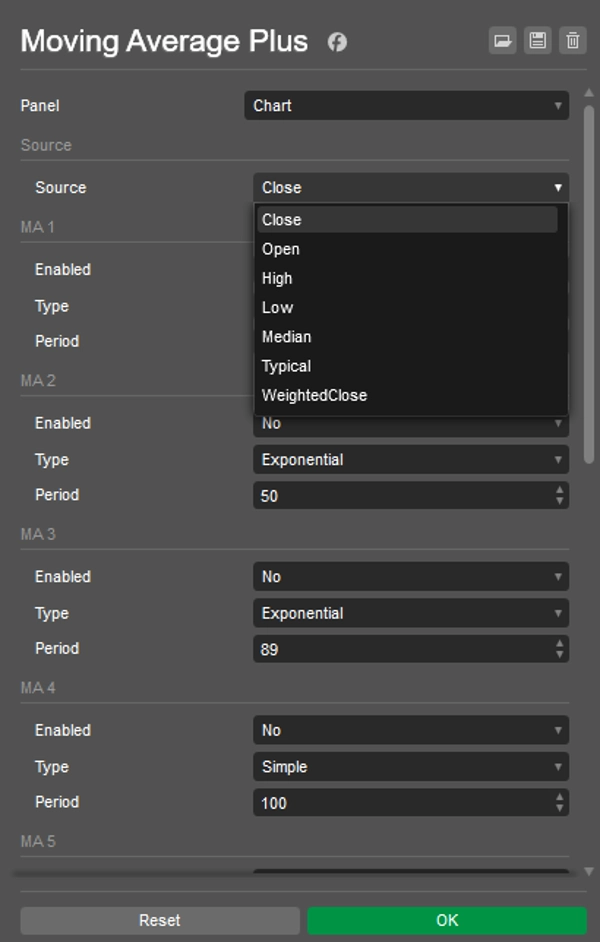
Global
- Source – price input used by all lines: Close, Open, High, Low, Median, Typical, or Weighted Close.
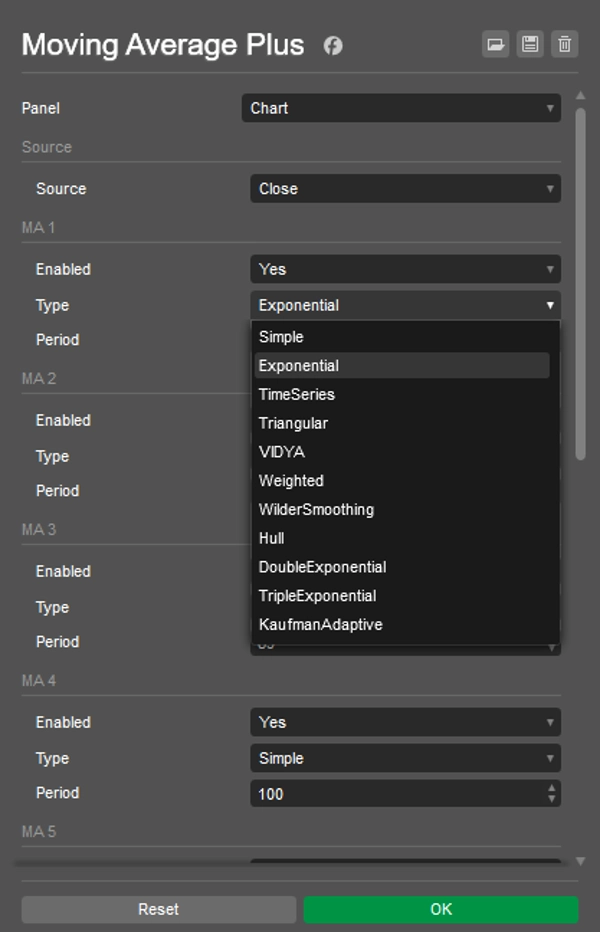
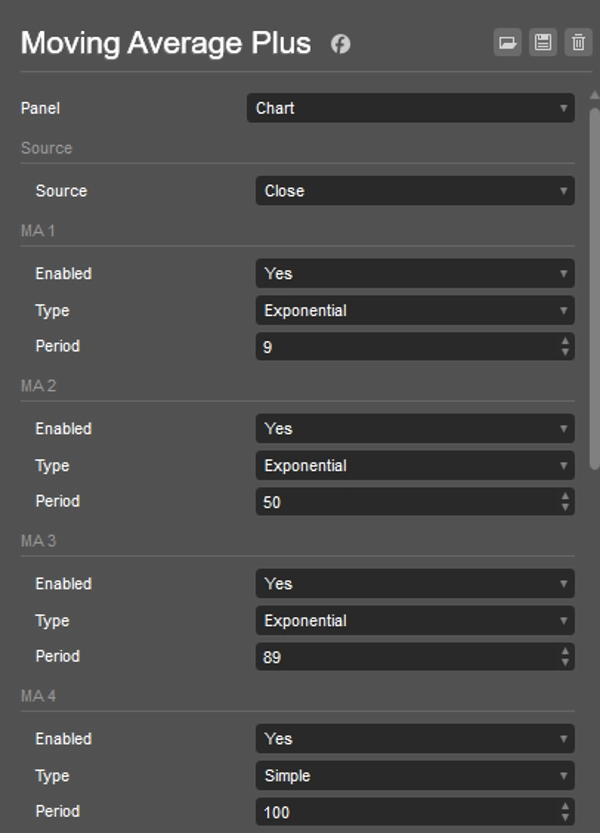
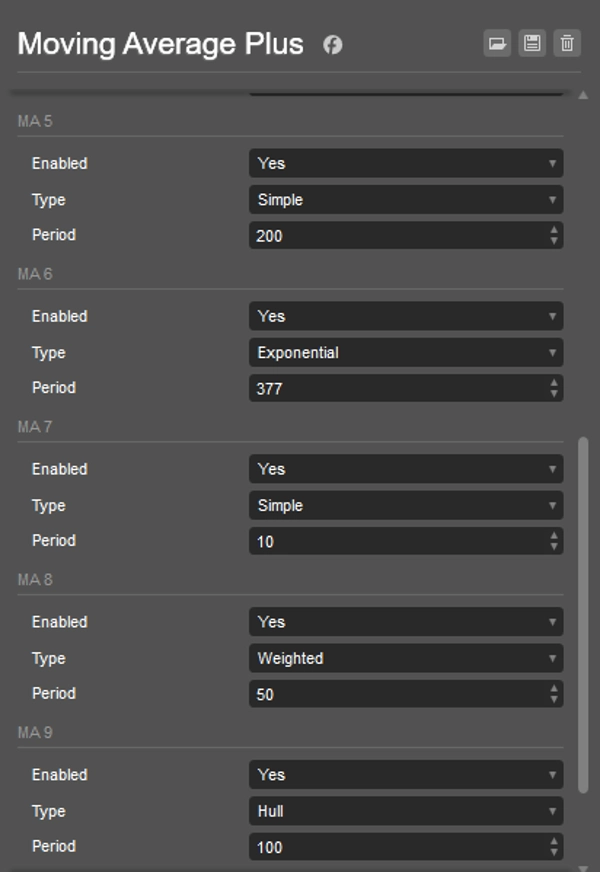
Per line (MA 1 … MA 10)
- Enabled – turn the line on/off (disabled lines don’t compute).
- Type – pick any from cTrader’s
MovingAverageType(e.g., Simple, Exponential, Weighted, Wilder Smoothing, Hull, Triangular, Time Series, etc.).
Note: some types depend on your cTrader version; if a type isn’t available (e.g., Hull), choose another. - Period – MA length (≥1).
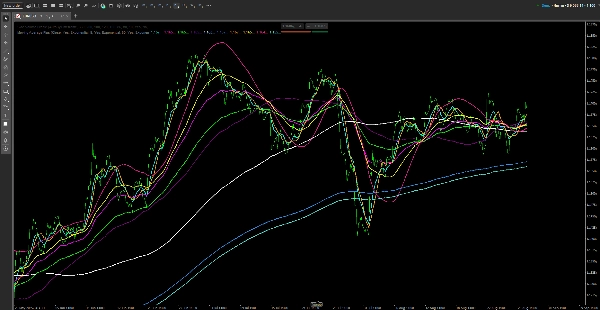
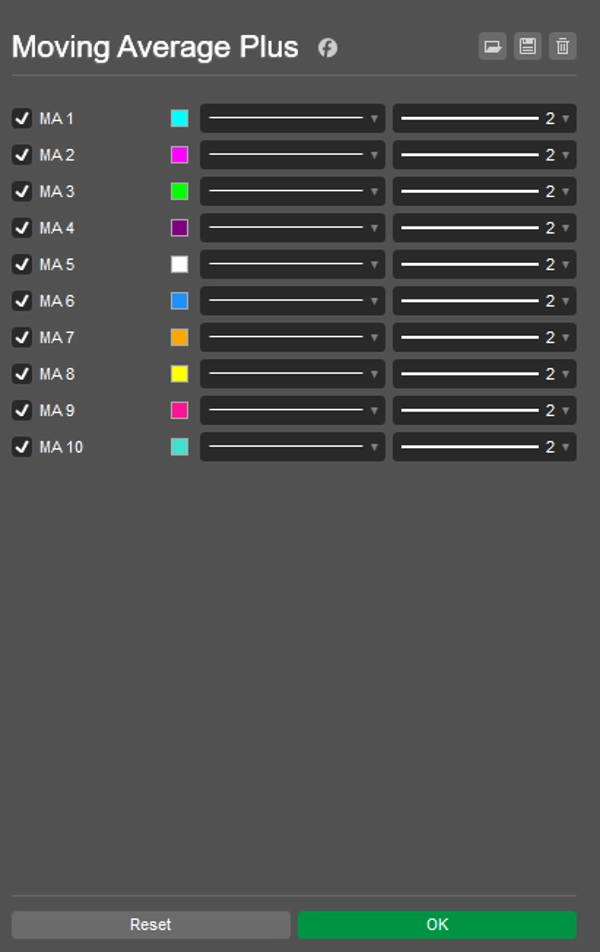
Colors & thickness
- Set in the Colors tab of the indicator parameters for each output (“MA 1” … “MA 10”).
Tips
- For performance, disable unused lines.
- If you change Source or Type/Period, the indicator recalculates automatically.
- Wilder in cTrader is named Wilder Smoothing (
MovingAverageType.WilderSmoothing).
Summary
AI summary
Moving Average Plus is a technical indicator for trading platforms that provides up to 10 configurable moving average lines. Each line can be individually enabled or disabled to optimize performance. Users select a single price source—such as Close, Open, High, Low, Median, Typical, or Weighted Close—that applies to all moving averages. For each line, the type of moving average can be chosen from various options including Simple, Exponential, Weighted, Wilder Smoothing, Hull, Triangular, and Time Series, depending on platform support. The period (length) of each moving average is adjustable with a minimum of 1. Colors and line thickness for each moving average are customizable through the indicator’s color settings. The indicator automatically recalculates when changes are made to the price source, type, or period. This tool is designed to assist traders in analyzing price trends by overlaying multiple moving averages with flexible configurations on their charts.
Indicator profile
Customer reviews
0.0
Reviews: 0
Customer reviews
No reviews for this product yet. Already tried it? Be the first to tell others!
Discussion
FAQ
Products available through cTrader Store, including trading bots, indicators and plugins, are provided by third-party developers and made available for informational and technical access purposes only. cTrader Store is not a broker and does not provide investment advice, personal recommendations or any guarantee of future performance.


Price
Since 26/05/2025
385.09M
Traded volume
60.66K
Pips won
14
Sales
1.4K
Free installs