
Description
How to Trade Using the Donchian (Breakout) Strategy
- Buy when the price breaks the N-period high (Upper).
- Sell when the price breaks the N-period low (Lower).
- Hold the position while the trend continues; exit on an opposite breakout or via a trailing stop.
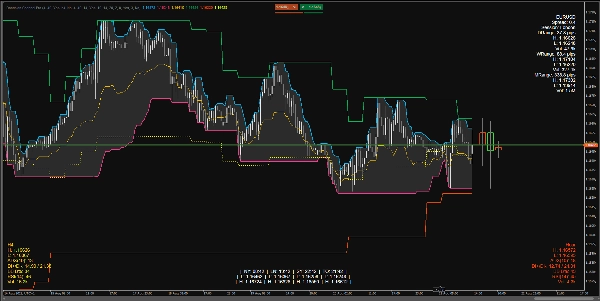
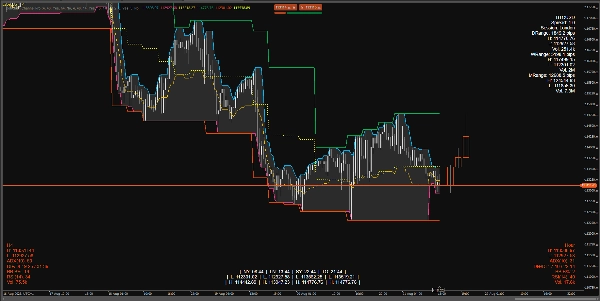
What the Indicator Shows on the Chart
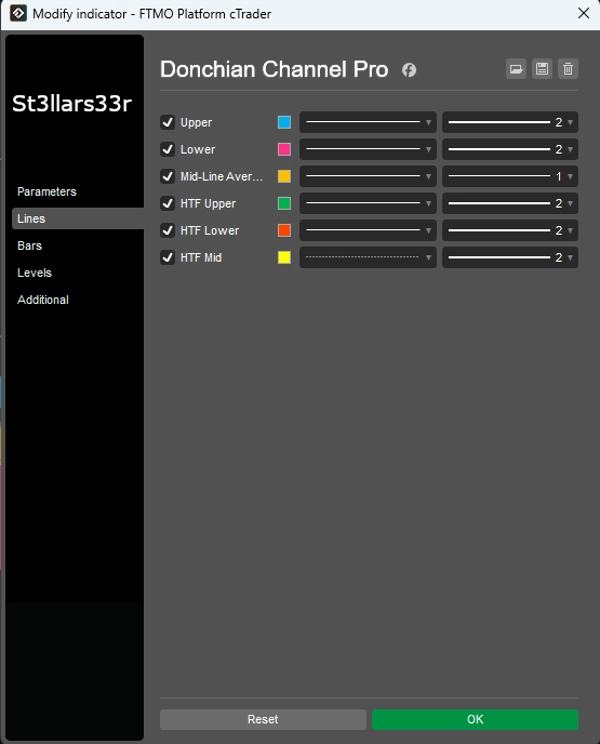
Donchian on the Current Timeframe (TF):
- Upper: The highest price over the Upper Channel bars.
- Lower: The lowest price over the Lower Channel bars.
- Mid: The midpoint between Upper and Lower.
HTF Overlay: Donchian lines from a higher timeframe overlaid on the chart:
- HTF Upper, HTF Lower, HTF Mid
- HTF Candles HUD: Rectangles representing higher timeframe candles, anchored to the right of the last bar on the current TF.
HUDs (Heads-Up Displays) at Bottom/Top:
- TopRight: Information panel for the symbol + daily/weekly/monthly ranges.
- BottomLeft: HTF HUD (metrics for the higher timeframe).
- BottomRight: Mid TF HUD (metrics for the intermediate timeframe).
- BottomMid: Session clocks + High/Low for each session (persistent).
What Each HUD Displays
TopRight (Top Right)
- SymbolName
- Spread: Spread in pips.
- Session: Current active session (based on specified hours).
- DRange/WRange/MRange: Daily/weekly/monthly range in pips.
- H/L/Vol: High/Low and total volume for the respective period.
BottomLeft (Bottom Left) — HTF HUD
- TF Name (e.g., H4, D1, etc.)
- H/L: Current high/low of the last (or active) HTF bar.
- ADX(n), DI+/DI-: Trend indicators.
- BB B%: Where the current price is relative to Bollinger Bands on HTF (0 near lower band, 100 near upper band).
- RSI(n)
- Vol: Volume on HTF.
- HUD Color:
- Green: Range expanding upward (DI+ and ADX rising).
- Red: Increasing downward pressure (DI- rising).
- Yellow: Neutral/undefined.
BottomRight (Bottom Right) — Mid TF HUD
- Same as HTF HUD, but for the intermediate timeframe (Mid Timeframe).
BottomMid (Bottom Center) — Clocks + Session H/L
- Time in NY, LN, SY, TO.
- L/H for each session.
- Persistent Logic: When a session is inactive, shows H/L of the last completed session; when a new session starts, values reset and recalculate.
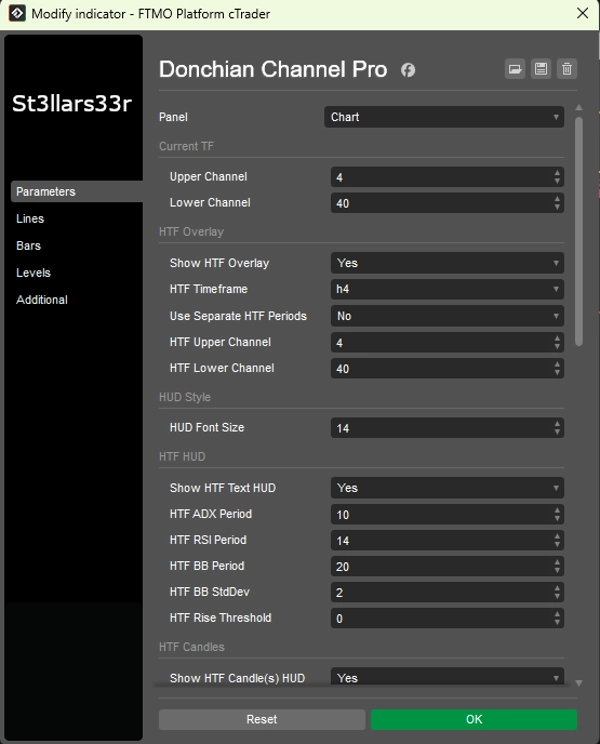
Parameters and How to Use Them
Group: Current TF (Current Donchian)
- Upper Channel: Number of bars for the upper channel. Larger value = less frequent updates, flatter line.
- Lower Channel: Number of bars for the lower channel.
Group: HTF Overlay (Higher Timeframe Donchian Overlay)
- Show HTF Overlay: Enables HTF lines on the chart.
- HTF Timeframe: Select higher timeframe (e.g., Hour4).
- Use Separate HTF Periods: If true, HTF Upper/Lower use their own parameters; if false, uses current Upper/Lower.
- HTF Upper Channel: Length of the upper channel for HTF.
- HTF Lower Channel: Length of the lower channel for HTF.
Group: HUD Style
- HUD Font Size: Font size for all HUDs (TopRight, BottomLeft, BottomRight, BottomMid).
Group: HTF HUD (Bottom Left)
- Show HTF Text HUD: Display text HUD for HTF.
- HTF ADX Period: ADX/DI period. Larger = smoother, less noise, but slower response.
- HTF RSI Period: RSI period.
- HTF BB Period: Bollinger Bands period.
- HTF BB StdDev: Standard deviation multiplier for BB (classic is 2.0).
- HTF Rise Threshold: Sensitivity to rising metrics (affects HUD color).
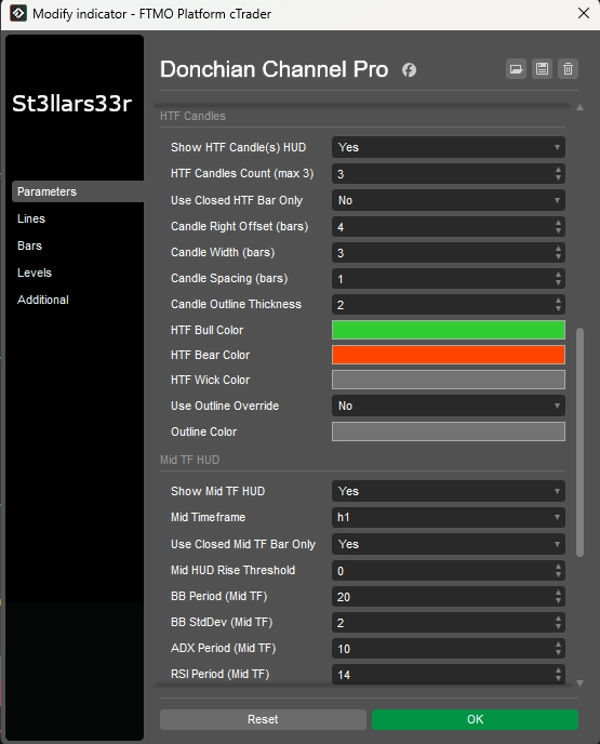
Group: HTF Candles (Right, Near Last Bar)
- Show HTF Candle(s) HUD: Display HTF candles on the right.
- HTF Candles Count (max 3): Number of HTF candles (1–3).
- Use Closed HTF Bar Only: If true, uses only closed HTF candles (stable values). If false, includes the current open candle.
- Candle Right Offset (bars): Offset to the right in bars of the current TF from the last bar (anchor).
- Candle Width (bars): Width of the candle rectangle in current TF bars.
- Candle Spacing (bars): Gap between candles.
- Candle Outline Thickness: Thickness of candle outlines.
- HTF Bull Color / HTF Bear Color: Colors for bullish/bearish candles.
- HTF Wick Color: Color for wicks.
- Use Outline Override: If true, candle body is drawn with an outline (Outline Color) without bull/bear fill.
- Outline Color: Color for outline when Use Outline Override = true.
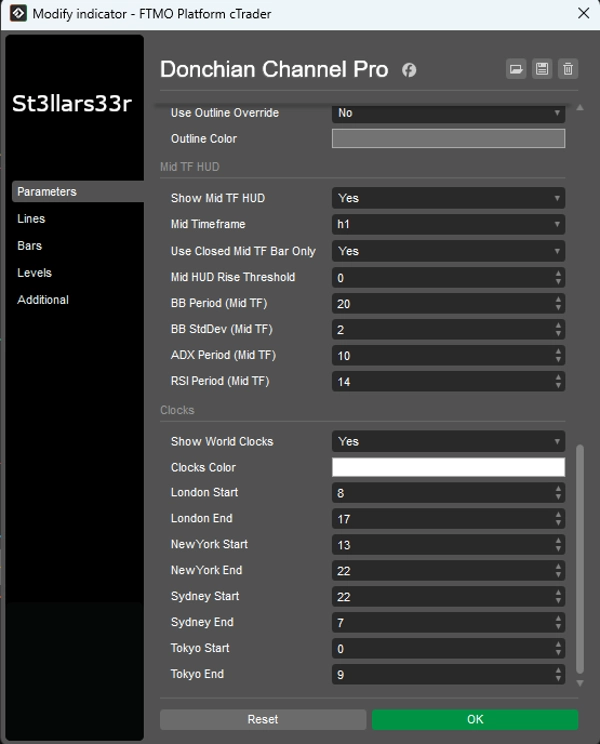
Group: Mid TF HUD (Bottom Right)
- Show Mid TF HUD: Enables HUD for the intermediate TF.
- Mid Timeframe: Select intermediate TF (e.g., Minute15).
- Use Closed Mid TF Bar Only: Same as HTF, but for Mid TF.
- Mid HUD Rise Threshold: Color sensitivity for Mid TF HUD.
- BB Period (Mid TF), BB StdDev (Mid TF): Bollinger Bands settings for Mid TF.
- ADX Period (Mid TF), RSI Period (Mid TF): ADX and RSI periods for Mid TF.
Group: Clocks (Bottom Center)
- Show World Clocks: Display block with clocks and session H/L.
- Clocks Color: Text color for clocks/sessions.
- London Start / London End: Start/end hours for the London session.
- NewYork Start / NewYork End: For New York.
- Sydney Start / Sydney End: For Sydney.
- Tokyo Start / Tokyo End: For Tokyo.
Clocks: Show real local time for cities (via OS time zones with a fallback offset).
- Session activity (and H/L) calculations use broker server time (Server.Time). If the server is not in UTC, session hours may shift—adjust Start/End as needed for your server.
- If a session crosses midnight (End < Start), the indicator automatically accounts for the date transition.
- When a session is inactive, the H/L of the last completed session is shown; when a new session starts, data resets and recalculates.
Summary
Customer reviews
5 | 50 % | |
4 | 50 % | |
3 | 0 % | |
2 | 0 % | |
1 | 0 % |


!["Gaussian Channel [Iridio Capital]" logo](https://cdn.ctrader.com/image/webp/7c039209-5573-4a54-a072-f9528b503103_41960)


