
Institutional Flow Radar
Indicator
3 purchases
Version 1.0, Nov 2025
Windows, Mac
4.3
Reviews: 3
Description
Institutional Flow Radar – Description
Concept:
Institutional Flow Radar scans the chart for abnormal volume events and classifies them into two groups:
- Capital → activity attributed to stronger / more informed participants
- Public → activity attributed to the broader crowd
It then:
- draws horizontal levels at those events,
- marks the most relevant events with colored bubbles,
- and shows a P/L summary comparing how much volume of Capital vs Public is currently in profit or loss.
In one glance, you see where big volume hit the tape, who is winning, and which prices are still holding.
How it works (short version)
- For every bar, the algorithm computes a Z-score of volume over the last N bars (Period).
- If the absolute Z-score is above your Threshold |Z|, that bar is tagged as a volume event.
- The candle structure (body vs total range) is used to classify the event:
- smaller body, long wicks → Capital (absorption / more complex behaviour)
- larger body, directional move → Public (crowd-style breakout / chase)
- A horizontal level is drawn at the event price and kept until price trades cleanly through that level (mitigation).
- For each active level, the Radar checks if current price is:
- in profit for that side (price has moved in the event’s direction), or
- in loss (price has moved against it).
- The P/L summary box aggregates volumes of all active levels:
- Capital Profit vs Capital Loss
- Public Profit vs Public Loss
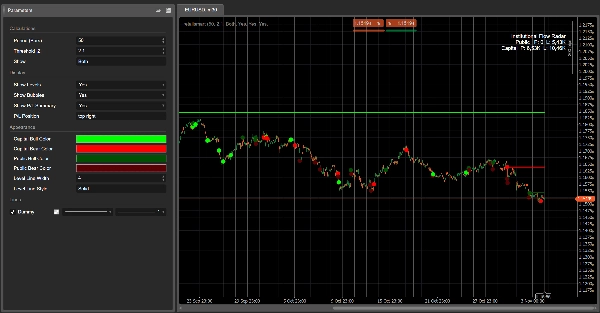
Visual elements
- Capital levels:
- Up events → bullish Capital level (e.g. bright green / aqua)
- Down events → bearish Capital level (e.g. bright red)
- Public levels:
- Up events → bullish Public level (greyish tone)
- Down events → bearish Public level (darker grey / charcoal)
- Bubbles:
- Circles on the most significant events, colored by:
- direction (bullish/bearish)
- class (Capital / Public)
- P/L Summary box:
- Rows: Public, Capital
- Columns: Profit, Loss
- Cell background intensity increases with the corresponding volume.
Suggested parameter labels (English)
- Period (Bars): number of bars used to compute the volume Z-score.
- Threshold |Z|: minimum absolute Z-score to mark an event.
- Show:
Capital,Public, orBoth– which class to display. - Show Levels / Show Bubbles / Show P/L Summary
- Capital Bull Color / Capital Bear Color
- Public Bull Color / Public Bear Color
- Average Line Width / Average Line Style
Summary
AI summary
Institutional Flow Radar is a trading indicator that identifies and classifies abnormal volume events on price charts into two categories: Capital (activity from stronger or more informed participants) and Public (activity from the broader crowd). It calculates a volume Z-score for each bar over a specified period and flags bars exceeding a set threshold as volume events. These events are further classified based on candle structure—smaller bodies with long wicks indicate Capital activity, while larger bodies with directional moves indicate Public activity.
The indicator visually marks these events by drawing horizontal levels at event prices, which remain until price moves decisively through them. Significant events are highlighted with colored bubbles indicating direction (bullish or bearish) and classification (Capital or Public). A P/L summary box aggregates volume at active levels, showing Capital and Public volumes currently in profit or loss.
Users can customize parameters such as the period for Z-score calculation, threshold for event detection, and visual settings including colors for bullish and bearish levels for both Capital and Public groups. This tool provides a consolidated view of where large volume occurred, which participant group is prevailing, and which price levels are holding, aiding in volume-based breakout analysis.
Indicator profile
Customer reviews
4.3
Reviews: 3
5 | 33 % | |
4 | 67 % | |
3 | 0 % | |
2 | 0 % | |
1 | 0 % |
Customer reviews
November 18, 2025
The only reason it stays interesting is the trading notes stop feeling so random, and two sessions say more than one clean chart.
November 9, 2025
Discussion
FAQ
Breakout
Products available through cTrader Store, including trading bots, indicators and plugins, are provided by third-party developers and made available for informational and technical access purposes only. cTrader Store is not a broker and does not provide investment advice, personal recommendations or any guarantee of future performance.


Price
42.11M
Traded volume
6.13M
Pips won
221
Sales
8.34K
Free installs