

VWAP Bands
Indicator
Version 1.0, Jul 2026
Windows, Mac
Trading product for VWAP Bands Indicator Flag AI-assisted, image 2
Trading product for VWAP Bands Indicator Flag AI-assisted, image 3
Trading product for VWAP Bands Indicator Flag AI-assisted, image 4
Trading product for VWAP Bands Indicator Flag AI-assisted, image 5
Trading product for VWAP Bands Indicator Flag AI-assisted, image 6
Since 07/05/2026
3
Sales
63
Free installs

Description

Description:

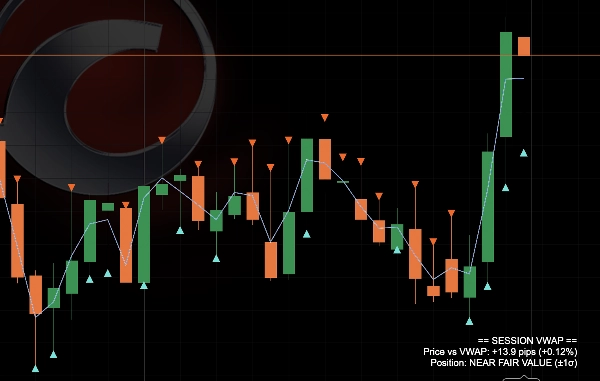
Session VWAP Bands plots a volume-weighted average price anchored to your chosen session (daily reset by default) alongside three tiers of statistical deviation bands — the same fair-value framework used on institutional equity and futures desks, brought to retail forex and CFD charts.

What it analyses: every bar's typical price (high+low+close ÷ 3) weighted by volume, accumulated from the session start. From that it derives the running VWAP and the standard deviation of price around it, then projects 1σ, 2σ, and 3σ bands above and below.

How to read it:

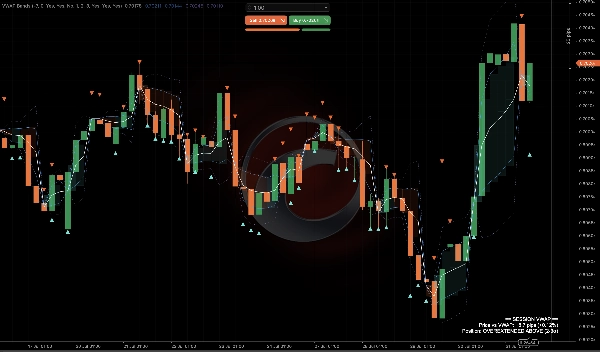
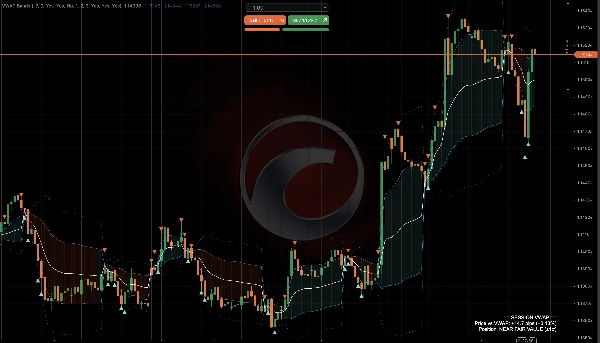
  • The white VWAP line is the session's volume-weighted fair value — price above it favours buyers for the session, below favours sellers.
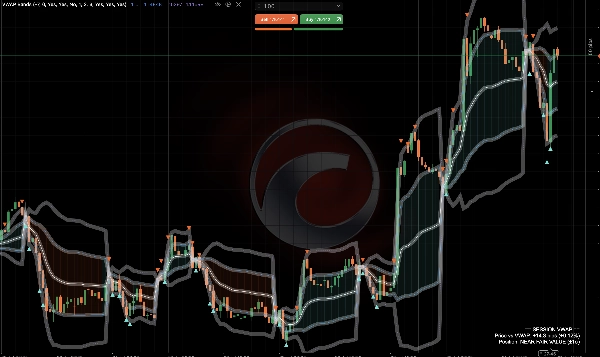
  • The inner bands (1σ, solid) mark the normal trading range around fair value.
  • The outer bands (2σ/3σ, dotted) mark statistically stretched zones — price rarely spends long beyond these without reverting or triggering a strong trend continuation.
  • A soft gradient cloud shades the space between price and the 1st band, shifting colour depending on which side of VWAP price is trading — a quick visual read of session bias.
  • Small triangle markers print automatically whenever price wicks beyond the 2nd deviation band and closes back inside — a flag for potential mean-reversion at an extreme.
  • The panel in the corner gives a live plain-English read: distance from VWAP in pips and %, plus a zone label like "OVEREXTENDED ABOVE (2-3σ)."

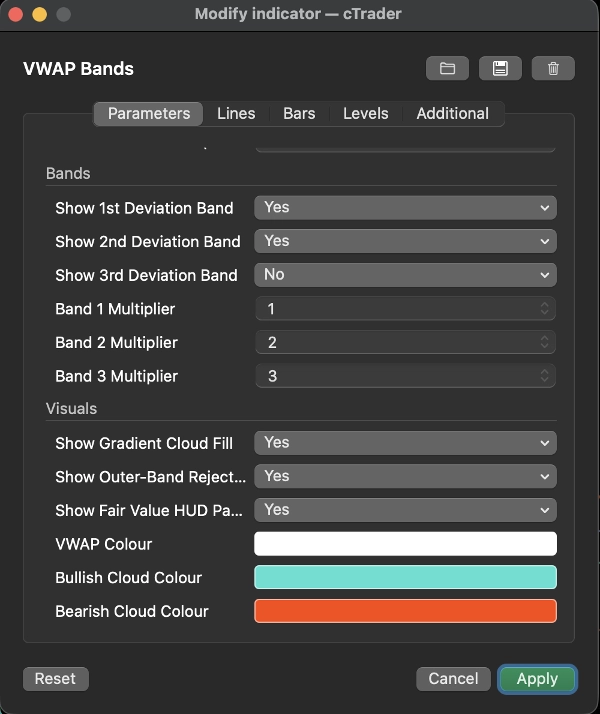
Key settings: session reset time (with a server-time-to-NY offset for accurate daily resets), independent on/off toggles and custom multipliers for each of the three band tiers, cloud fill and rejection marker toggles, and full colour customisation.

Typical use cases: judging intraday fair value on indices, forex majors, and gold; fading extended moves back toward VWAP when price tags the outer bands; using VWAP as dynamic intraday support/resistance; confirming whether a breakout is happening from a "stretched" or "fair value" starting point.

Best suited for: intraday and scalping traders who want an objective, statistically grounded read of fair value rather than a static line — useful for both discretionary bias-forming and as a confluence tool alongside other setups. Less relevant for pure long-term position traders.

Summary

AI summary
VWAP Bands is a trading indicator that plots the volume-weighted average price (VWAP) anchored to a user-defined session, resetting daily by default. It includes three tiers of statistical deviation bands (1σ, 2σ, and 3σ) above and below the VWAP, providing a fair-value framework commonly used by institutional equity and futures traders, adapted here for retail forex, indices, and CFD markets.
The indicator calculates each bar’s typical price (average of high, low, and close) weighted by volume from the session start, deriving the running VWAP and standard deviation. The white VWAP line represents the session’s fair value, with price above favoring buyers and below favoring sellers. The inner bands mark normal trading ranges, while outer bands indicate statistically stretched price zones that often precede reversions or strong trend continuations.
Visual features include a gradient cloud shading between price and the first band, changing color based on price position relative to VWAP, and triangle markers signaling price rejection beyond the second deviation band, suggesting potential mean reversion. A corner panel displays live metrics such as distance from VWAP in pips and percentage, plus zone labels like "OVEREXTENDED ABOVE (2-3σ)."
Key settings allow customization of session reset time, band multipliers, cloud and marker toggles, and colors. VWAP Bands is suited for intraday and scalping traders seeking an objective, statistically grounded measure of fair value and dynamic support/resistance.
Indicator profile

Customer reviews

0.0
Reviews: 0
Customer reviews
No reviews for this product yet. Already tried it? Be the first to tell others!

Discussion

FAQ

Flag
AI-assisted
Volume
Market Structure
Triangle
VWAP
Support & Resistance
Products available through cTrader Store, including trading bots, indicators and plugins, are provided by third-party developers and made available for informational and technical access purposes only. cTrader Store is not a broker and does not provide investment advice, personal recommendations or any guarantee of future performance.

More from this author

Multi-platform plugin
News Filter
Risk Alerts
+5
Smart Money Concepts and ICT Trading Analytics Platform. Daily bias estimator, ICT strategty checker, TP and SL.
Indicator
AI-assisted
Order Block
+5
The daily bias estimator indicator uses ICT concepts to show whether the chart is bullish or bearish on multi-time frame
Indicator
ATR
BOS
+5
Full ICT/SMC 4-step setup checker that alerts a long or short setup.
Indicator
Volume
Fibonacci
+5
Classic 9:30 Opening Range Breakout — auto-plots the range, flags volume-confirmed breakouts long or short, live.
Indicator
MSS
AI-assisted
+5
Live ICT Silver Bullet detection: liquidity sweeps, structure shifts, and killzone-gated FVGs, graded and glowing in rea
Indicator
ATR
Key Levels
+5
CPR indicator that actually predicts the day ahead: width percentile scoring for breakout-day detection
Indicator
Triangle
Double Top
+5
Know which liquidity sweeps are real. Auto-tracks EQH/EQL and confirms genuine reversals, not just broken levels.
Indicator
BOS
EMA
+5
Directional volume heatmap: see if a price zone was built on buying or selling, not just how much.

You may also like

Indicator
AI
SMC
+7
The ultimate tool for Price Action and ICT. High, Low and Mid levels for days, weeks Inc. NY Midnight and Custom Range.
Indicator
Volume
Key Levels
+1
Order book indicator .Don't trade against the flow. Trade with the truth!
Indicator
Key Levels
Order Block
+2
It monitors trend lines on price charts and fires multi-channel alerts and optionally places trades when price crosses..
Indicator
Forex
Crypto
+3
Perfect Trend
Indicator
AI-assisted
Order Block
+5
The daily bias estimator indicator uses ICT concepts to show whether the chart is bullish or bearish on multi-time frame
Indicator
BOS
Fibonacci
+4
Automatically draws major trading sessions, killzones, and SMC daily liquidity targets directly on your cTrader charts.
Indicator
Prop
Forex
+4
Universal multi time frame 'Moving Average' indicator with extended features
Indicator
Market Structure
Stop guessing which trading session you in, with Sessions indicator sessions are in your finger tips like a pro
Indicator
Forex
BTCUSD
+5
Trend analysis, automatic analysis, position, swingtrader, scalper
Indicator
Customizable window inside your platform, access to any website Calendar
Indicator
AI
SMC
+13
Dynamic Liquidity Depth exposes hidden volume
Indicator
Indices
this indicator shows previous day high low and closed with precise manner.
Indicator
MACD
Crypto
A simple tool to control market sessions. fixed the display on the weekend.
Indicator
Forex
Crypto
+4
Spot powerful 3-candle reversal patterns like Morning/Evening Star and Soldiers/Crows at key swing highs and lows
Indicator
Drawdown Monitor
Proprietary trading desk risk monitoring dashboard!
Indicator
Signal
Breakout
+1
Bolliger Bands + Hamster-Coder™ Timeframe Decoupling
Indicator
CandleColourFlow MultiFx - optimized to work on Fx Majors, Fx MInors, Fx Crosses
Indicator
MSS
AI-assisted
+5
Live ICT Silver Bullet detection: liquidity sweeps, structure shifts, and killzone-gated FVGs, graded and glowing in rea

Price

Since 07/05/2026
3
Sales
63
Free installs



























