Brokers & props
For business
00
Days
:
00
Hours
:
00
Minutes
:
00
Seconds
Indicator
NAS100
NZDUSD
XAUUSD
Commodities
Forex
EURUSD
GBPUSD
BTCUSD
Indices
Prop
Stocks
Crypto
USDJPY
Market Structure Shift
10/12/2025
Desktop
Since 04/03/2025
Traded volume
36.44M
Pips won
6M
Sales
41
Free installs
2354
"Market Structure Shift" uploaded image"Market Structure Shift" uploaded image

🌐 Market Structure Shift – Professional Market Structure Oscillator

Identify True Trend Direction. Filter Noise. Trade with Confidence.

Market Structure Shift is a next-generation structural trend oscillator built for traders who want clarity, accuracy, and reliability in all market conditions.
Instead of relying on lagging moving averages or volatility-based tools, this indicator focuses on the core of price behavior: swing highs and swing lows.
The result is a clean, highly responsive trend model that helps you instantly identify:

  • True market bias
  • Structure transitions
  • Trend continuation strength
  • Hidden momentum shifts

Whether you swing trade, intraday trade, or run algorithmic systems, Market Structure Shift brings a professional-grade structural framework directly into your chart.


🔥 Why Market Structure Matters

Most indicators analyze price after it has already moved.
Market structure works differently — it measures the foundation of trend development:

  • Higher Highs / Higher Lows → Bullish structure
  • Lower Highs / Lower Lows → Bearish structure

This reveals the direction the market is building toward, not just what price is doing moment to moment.

Market Structure Shift automates this entire process and transforms it into an easy-to-read oscillator.


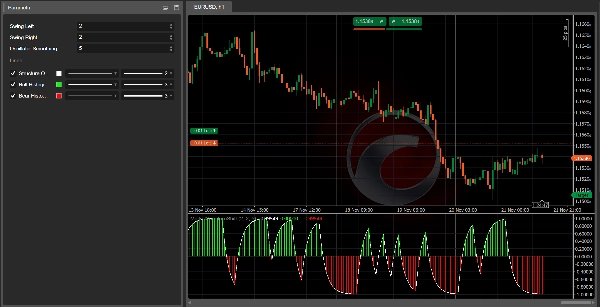
📊 What the Indicator Shows

1. Structure Oscillator Line (White)

A smoothed EMA-based trend line that clearly displays dominant structure:

  • Above 0 → Bullish structure
  • Below 0 → Bearish structure
  • Near 0 → Structure instability or trend transition

One glance reveals where the market truly stands.


2. Bullish Histogram (Green)

Displays strength and momentum inside a bullish structure.
Stronger bars = stronger upward pressure.

Perfect for confirming long setups.


3. Bearish Histogram (Red)

Shows the momentum and strength of bearish structure.
Stronger bars = stronger downward trend.

Ideal for validating short opportunities.


🎯 How Traders Use It (Professional Workflow)

A. Trend Confirmation Filter

Only trade in the direction of structural momentum:

  • Long trades when the oscillator is above 0
  • Short trades when the oscillator is below 0

This simple rule alone eliminates many false setups.


B. Structural Reversal Detection

Major transitions are visible when the oscillator crosses the zero line:

  • Red → Green = New bullish structure
  • Green → Red = New bearish structure

This offers early insight into trend shifts long before traditional tools react.


C. Multi-Timeframe Optimization

The indicator is exceptionally powerful in MTF workflows:

  • Use H4/H1 for trend framework
  • Use M30/M15 for entries

Prevent counter-trend trades and maximize accuracy.


D. Synergy With Market Structure Signals

Market Structure Shift becomes a complete trading system when combined with Market Structure Signals, which provides:

  • BUY/SELL arrows
  • Visual shift markers
  • Structural break alerts

Together they create a full top-down structure-based methodology.


⚙️ Designed for All Markets

✔ Forex
✔ Indices
✔ Crypto
✔ Metals
✔ Synthetic markets
✔ Futures (via CFD proxies)

Highly adaptable due to parameter control over:

  • Swing detection
  • Smoothing strength
  • Sensitivity to structural changes


📈 Recommended Settings

  • Swing Left/Right: 2–3 for Forex and Indices, 3–3 for Crypto
  • Oscillator Smoothing: 5–8 for balanced responsiveness

Built to work out-of-the-box, but fully customizable.


💬 Join Our Community for Free Tools & Optimizations

Click the link in my profile to join our trading community, where you’ll find:

  • Optimized parameter sets
  • Extra tools
  • Structure-based strategies
  • Exclusive resources for AlgoTrend indicators

A great space to grow your system and improve consistency.


0.0
Reviews: 0
Customer reviews
No reviews for this product yet. Already tried it? Be the first to tell others!
More from this author
Indicator
NAS100
NZDUSD
Martingale
+26
Volume Delta
Read aggressive flow in real time. Flexible resets (Day/Week/Month), optional EMA smoothing, and non-repainting cumulati
cBot
NAS100
NZDUSD
Martingale
+26
ElliottWave Pro cBot
The Elliott Wave Pro Bot is a sophisticated and highly configurable algorithmic trading system
cBot
NAS100
NZDUSD
Martingale
+26
ElliottWaveBot
N.B.: Results with an initial invested capital of 100 euros.
cBot
Grid
NAS100
RSI
+20
Breakout Premium Pro v2.0
A price-action-first algorithm to trade Breakout, Approach, and Return around prior High/Low levels—with Prop-style risk
Indicator
Grid
NZDUSD
XAUUSD
+16
vWAP Free
Editions: Free (core VWAP + bands) · Pro (multi‑VWAP, click‑to‑anchor, alerts).
cBot
Indices
RSI
Forex
+2
US 2000+MACD+ADR+ADMIR+RSI+MANY MORE-TF4M
N.B.: Results with an initial invested capital of 100 euros.
Indicator
NAS100
NZDUSD
Martingale
+26
Breakout channel
Breakout Channels automatically detects consolidation ranges and highlights when price breaks out of them.
cBot
NAS100
NZDUSD
Martingale
+26
Dynamic Trendline Deluxe Pro Cbot - PROP edition
Major Update Announcement: Advanced Prop Firm Risk Management is Here! 🚀
Indicator
NAS100
NZDUSD
Breakout
+14
ZIG ZAG Free
ZigZag Free is a clean swing-detection tool that marks significant pivot highs/lows
cBot
NAS100
NZDUSD
Martingale
+26
Prop Ready Bot_v.2.0
The Prop-Ready Bot The Definitive Automaton for Challenges 🛡️ V2.0
Indicator
NAS100
NZDUSD
Martingale
+26
Volume Bubble
Volume Bubbles is a lightweight yet powerful visual indicator for cTrader
cBot
Indices
ATR
US500 LONG&SHORT TF 5M ALL SEASON!
🚀N.B.: Results with an initial invested capital of 100 euros.
Indicator
Grid
NAS100
NZDUSD
+15
EMA UP&DOWN 2025
SectorIndex Dual Moving Average Indicator: Your Market Compass 🧭
cBot
Breakout
ATR
Signal
EMA Up&Down 2025 Ctrader bot
✨ N.B.: Results with an initial invested capital of 100 euros.📈
Indicator
NAS100
NZDUSD
Martingale
+25
Volume Profile Suite trial7D
DEMO VERSION 7 DAYS VolumeProfileSuite is an advanced and flexible Volume Profile indicator for cTrader.
Indicator
NAS100
Breakout
XAUUSD
+14
Initial Range
Initial Range – Where the open writes the script.
cBot
RSI
BASIC us500 SHORT 35%
N.B.: Results with an initial invested capital of 100 euros.
cBot
NAS100
Indices
XAUUSD
+7
COT Institutional Sentiment Bot
Institutional COT sentiment, automated position trading and full prop-firm style risk control – all in one cBot.
You may also like
Indicator
NAS100
NZDUSD
Martingale
+25
Aggressive Entry Momentum MACD Power Guide
Entry Momentum MACD Power Guide
DailyPivotPoints
Daily Pivot Points plots key support and resistance levels to guide precise trading decisions.
Indicator
NAS100
XAUUSD
FVG
+6
Fair Value Gaps
The Fair Value Gap (FVG) Indicator identifies inefficiencies in price action where an imbalance occurs due to aggressive
Indicator
NAS100
NZDUSD
XAUUSD
+10
ALMA-Gaussian Trend Filter
📈 Adaptive ALMA-Gaussian hybrid trend filter with precision smoothing and clear buy/sell signals.
Previous Day Liquidity Zones (PDH - PDL)
Useful indicator for traders who want to visualize key price levels based on previous daily highs and lows.
Indicator
NAS100
NZDUSD
XAUUSD
+12
Volume Meter
Volume Meter
Indicator
Indices
RSI
Breakout
+9
Advanced HTF Trend Buy & Sell Trading System
Detects breakouts 📈 auto-draws levels 🚀 confirms trends 🐻 dynamic signals 🎨 customizable for any asset & timeframe.
Indicator
Stocks
Forex
Crypto
Trend Angle Indicator [Iridio Capital]
The Trend Angle Indicator provides a clear and intuitive way to visualize market trends.
Indicator
NAS100
XAUUSD
Stocks
+4
Orderblock Detector
This indicator displays the OrderBlocks of the current and higher timeframe, made by ICT's student.
Indicator
Bollinger
JMA
Jurik Moving Average (Jurik's Moving Average) triple adaptive filter with unique Jurik smoothing and dynamic factor.
Indicator
RSI
FVG
Commodities
+12
VWAP EMA CROSSOVER
VWAP (EMA) + MVWAP Mean Line — plotted directly on the main chart
Candle Timer & Strength Demo
Candle Timer & Strength DEMO for cTrader This is a DEMO version of the Candle Timer & Strength indicator. You can use al
zh-cn Variety Period time panel(multilanguage)
This indicator can be used to: change color, shape size, position, change font, increase or decrease, and other function
Larry Williams 9.1
Larry Williams 9.1
Indicator
Breakout
Signal
SMC
Free_ICT Breakers_BOS_MSS_withSourceCode
ICT Breakers (BOS/MSS) - Professional market structure and breakout detection tool.
Time To Break Even Lite Version
This is the trial version of Time To Break Even, which help you time your trade entry.
Indicator
NAS100
NZDUSD
XAUUSD
+12
FVG_Bruno
Fair Value Gap (FVG) indicator identifies price inefficiencies in the market by highlighting gaps between candlesticks.
Indicator
NAS100
NZDUSD
XAUUSD
+13
MACD Crossover PRO
Customize the MACD! Choose colors, get real-time tick updates, and see crossover points for enhanced trading precision.