
Descrizione
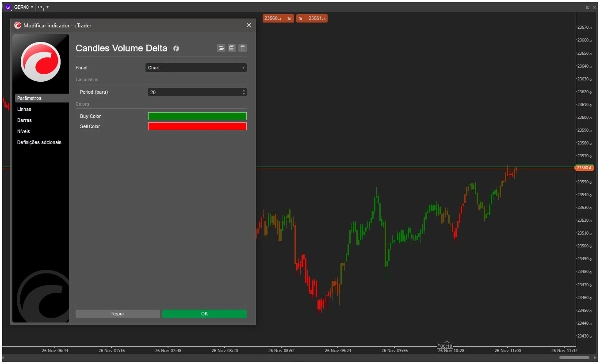
Candles Volume Delta è un indicatore potente e visivamente intuitivo che trasforma il volume tick grezzo in informazioni di trading utilizzabili. Colorando le barre dei prezzi in base alla pressione del volume di acquisto/vendita, fornisce un'indicazione visiva immediata del sentimento e della forza del mercato, aiutandoti a individuare potenziali continuazioni o inversioni di tendenza con un solo sguardo.
Caratteristiche principali
-
- 🟢 Analisi visiva del volume: Colora ogni barra dei prezzi in base al dominio del volume di acquisto/vendita
- 📊 Calcolo intelligente del Delta: Calcola il delta del volume su un periodo definito dall'utente
- 🎨 Colori personalizzabili: Schemi di colori di acquisto/vendita completamente regolabili
- ⚡ Elaborazione in tempo reale: Ottimizzato per un feedback visivo istantaneo sulle nuove barre
- 🛠️ Configurazione semplice: Configurazione semplice con impostazioni predefinite sensate
Come funziona
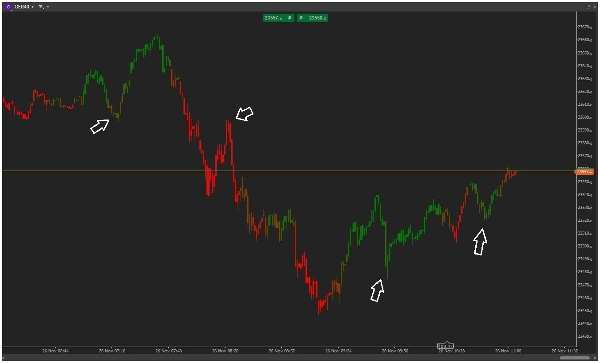
Candles Volume Delta analizza il volume tick sul periodo specificato (predefinito: 20 barre) e calcola la percentuale di volume di acquisto rispetto al volume di vendita:
-
- Barre verdi: Alta pressione di acquisto (tipicamente >60% volume di acquisto)
- Barre rosse: Alta pressione di vendita (tipicamente <40% volume di acquisto)
- Colori sfumati: Transizioni di colore morbide mostrano livelli intermedi di forza
L'indicatore utilizza una levigatura basata su ATR per garantire segnali stabili e significativi che si adattano alla volatilità attuale del mercato.
Applicazioni di trading
-
- Conferma della tendenza: Valida la forza della tendenza con la conferma del volume
- Segnali di inversione: Individua potenziali inversioni quando l'azione del prezzo contraddice il flusso del volume
- Validazione dei breakout: Conferma i breakout con prove di volume a supporto
- Sentimento di mercato: Valuta il dominio complessivo di acquirenti/venditori in qualsiasi timeframe
Perché Candles Volume Delta?
A differenza degli indicatori di volume complessi che ingombrano il tuo grafico, Candles Volume Delta fornisce un feedback visivo immediato attraverso una semplice codifica a colori. È leggero, veloce e ti offre le informazioni essenziali sul volume di cui hai bisogno senza dati eccessivi.
Perfetto per trader che vogliono:
-
- Valutazione rapida del sentimento di mercato
- Analisi del grafico pulita e non ingombrata
- Conferma visiva dei movimenti di prezzo
- Facile integrazione nelle strategie esistenti
Installa oggi e guarda i mercati attraverso la lente della dinamica del volume!
Riepilogo
Key features include customizable color schemes, real-time processing for instant visual feedback, and easy setup with sensible defaults. The indicator helps traders quickly assess market sentiment, confirm trends, identify potential reversals, validate breakouts, and gauge buyer/seller dominance across timeframes. It is designed to provide essential volume insights without cluttering the chart, making it suitable for integration into various trading strategies, including scalping and trend analysis. Supported markets include indices and other instruments where volume analysis is relevant.
Recensioni dei clienti
5 | 100 % | |
4 | 0 % | |
3 | 0 % | |
2 | 0 % | |
1 | 0 % |


![Logo di "[Stellar Strategies] Inside Bar with Signals"](https://cdn.ctrader.com/image/webp/1d9e8bfa-3b2c-4440-bb37-5856902008a7_30683)


