
الوصف
🚀 أكثر من 10,000 متداول يستخدمون بالفعل أفضل المؤشرات🏆
اكتشف لماذا يختارنا المحترفون – أقوى الأدوات على cTrader (المؤشرات، الخوارزميات، وcBots) في انتظارك.
👉 احصل على جميع أنظمتنا الأفضل هنا:
_______________________________________________
📌 مؤشرات هيكل السوق
· ✅ هيكل السوق المتقدم: Bos، Choch، SwinLevels، كتل الأوامر، هيكل السوقومكتشف السيولة
· 🔄 تحليل هيكل السوق الديناميكي لنقاط التحول
· 🧱 كتلة الأوامر
· ⚖️ اختلال السوق
· ⛓️ BOS & CHOCH
· 🧠 ICT قوة 3
_______________________________________________
🔚 أنظمة الخروج الذكية
_______________________________________________
📐 مؤشرات ZigZag
· ➖ ZigZag
_______________________________________________
🧱 مؤشرات الدعم والمقاومة
· 🟩 خطوط دعم ومقاومة SmartTrend
· 🧱 جميع مستويات الدعم والمقاومة
_______________________________________________
📊 مؤشرات الاتجاه والقناة
· 📊 سوبرتريند
· ⭐ قناة SSL المميزة
_______________________________________________
💧 أدوات الحجم والسيولة
· 📉 خريطة تصفية الرافعة المالية
_______________________________________________
⚡ مؤشرات الزخم وRSI
· 📈 مُشغل اتجاه RSI
· 🔎 تتبع ميل الشمعة متعدد المستويات
Tracker
_______________________________________________
🔮 أدوات التنبؤ والإسقاط
· 📐 التنبؤ بناءً على Linreg& ATR
· 📏 الانحدار الخطي فيبوناتشي متعدد الأطر الزمنية
· 📈 عارض تدفق السوق المدعوم بالحجم
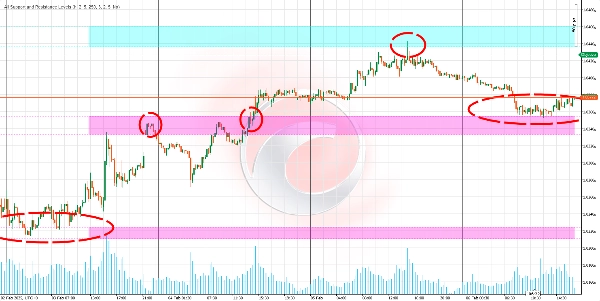
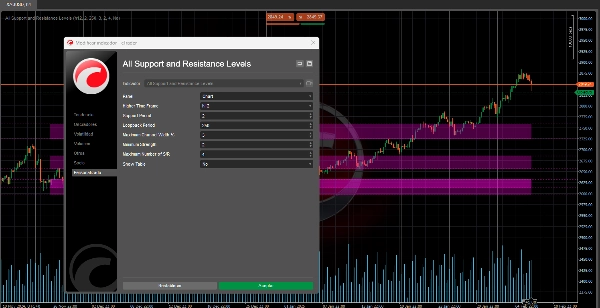
هذه الخوارزمية هي مؤشر دعم ومقاومة متقدم مصمم لمساعدتك في تحديد المستويات الرئيسية في السوق.
الميزة الرئيسية لها هي أنها تتيح لك عرض مستويات الدعم والمقاومة من أي إطار زمني (مثل اليومي، الأسبوعي، أو الشهري) مباشرة على الرسم البياني الذي تحلله، حتى لو كان على إطار زمني مختلف (مثل 15 دقيقة أو ساعة واحدة). 📊⏰
ما الغرض منه؟ 🎯
تحديد مناطق السوق الرئيسية:
- كشف المستويات التي قد يتوقف عندها السعر، يرتد، أو يكسر بقوة. 🛑↗️↘️
- يساعدك على اتخاذ قرارات أكثر وعيًا بشأن الدخول، الخروج، ووقف الخسارة. 💡📈📉
تحليل أطر زمنية متعددة دون تبديل الرسوم البيانية:
- عرض المستويات المهمة من أطر زمنية أعلى (مثل اليومي أو الأسبوعي) أثناء التداول على أطر زمنية أقل (مثل 15 دقيقة أو ساعة واحدة). 🕒📅
- يوفر لك رؤية أوسع للسوق دون الحاجة لتبديل الرسوم البيانية باستمرار. 🌍🔍
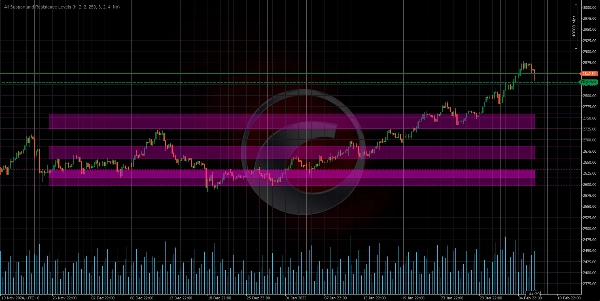
ترتيب الأولويات للمستويات المهمة:
- يقوم المؤشر بترتيب مستويات الدعم والمقاومة بناءً على "القوة" الخاصة بها، أي عدد مرات تفاعل السعر معها في الماضي. 💪📊
- هذا يساعدك على التركيز على المستويات الأكثر صلة وموثوقية. 🎯✅
كيف تعمل المنطق؟ 🧠⚙️
جمع البيانات:
- يأخذ المؤشر أسعار القمة والقاع من إطار زمني محدد (يومي، أسبوعي، إلخ). 📈📉
- تُستخدم هذه البيانات للبحث عن أنماط رئيسية في سلوك السعر. 🔍📊
كشف النقاط الرئيسية (المحاور):
- يحدد القمم والقيعان المحلية — النقاط التي وصل فيها السعر إلى قمة أو قاع مقارنة بالأسعار المجاورة. ⛰️🌄
- هذه النقاط مرشحة لتصبح مستويات دعم أو مقاومة. 🎯📌
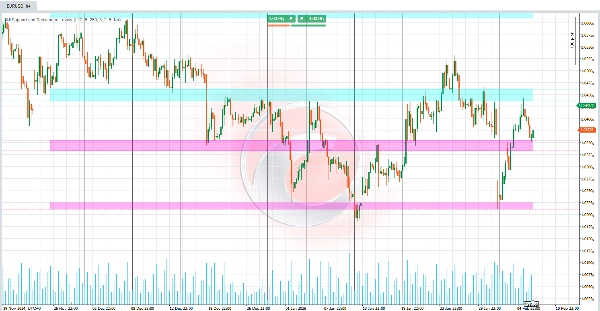
تجميع المستويات:
- يتم تجميع المستويات القريبة لتشكيل مناطق دعم أو مقاومة، بدلاً من خطوط دقيقة. 🟦🟧
- يعكس هذا الفكرة أن الدعم والمقاومة هي مناطق، وليست نقاطًا دقيقة. 📏🎯
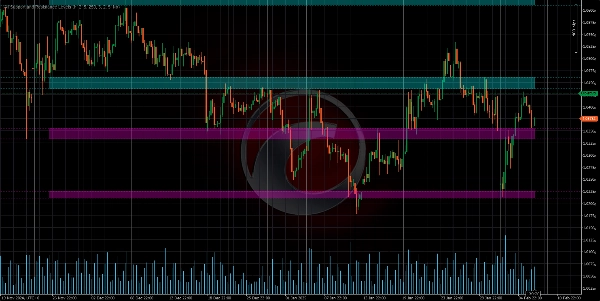
حساب قوة المستوى:
يتم تحديد "قوة" المستوى بواسطة عاملين:
- تكرار اللمسات: عدد المرات التي لمس فيها السعر أو اقترب من ذلك المستوى في الماضي. 🔄📊
- تجمع النقاط الرئيسية: عدد القمم أو القيعان القريبة من ذلك المستوى. 🔗📈
تُعتبر المستويات ذات القوة الأكبر أكثر أهمية. 💪🎯
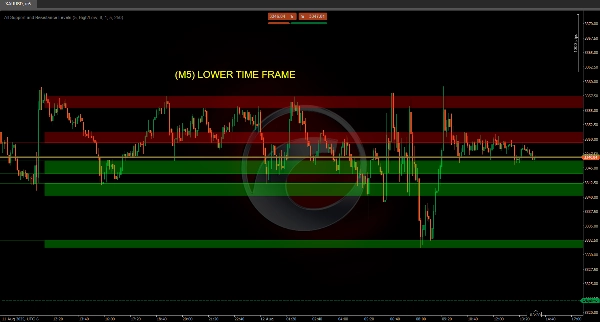
تصوير الرسم البياني:
- يتم رسم المستويات كخطوط أفقية أو مناطق ملونة على الرسم البياني. 🎨📊
- يعتمد لون كل مستوى على موقع السعر الحالي:
-
- المقاومة: إذا كان السعر أسفل المستوى. 🔴
- الدعم: إذا كان السعر فوق المستوى. 🟢
- ضمن النطاق: إذا كان السعر داخل نطاق المستوى. 🟡
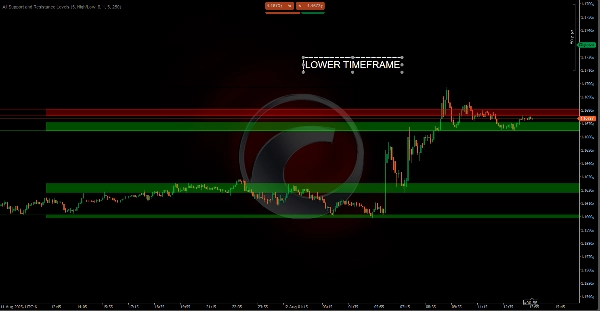
كيف يمكنك عرض أطر زمنية مختلفة على الرسم البياني الخاص بك؟ 🕒📊
الدعم والمقاومة من أطر زمنية أعلى على رسوم بيانية لإطارات زمنية أقل:
- على سبيل المثال، إذا كنت تحلل رسمًا بيانيًا لمدة 15 دقيقة، يمكن للمؤشر عرض المستويات الرئيسية من الإطار الزمني اليومي أو الأسبوعي. 🕒📅
- يتيح لك هذا رؤية مستويات سياقية أعلى مهمة دون مغادرة الرسم البياني الحالي. 🌍🔍
الدعم والمقاومة من أطر زمنية أقل على رسوم بيانية لإطارات زمنية أعلى:
- على الرغم من أنه أقل شيوعًا، يمكنك أيضًا عرض المستويات من أطر زمنية أصغر (مثل دقيقة واحدة أو 5 دقائق) على رسوم بيانية لإطارات زمنية أعلى (مثل اليومي أو الأسبوعي). 🕒📅
- يمكن أن يكون هذا مفيدًا لتحليل أكثر تفصيلاً ضمن سياق أوسع. 🔍📊
الملخص
The indicator analyzes price data by collecting highs and lows from specified timeframes, identifying local pivot points where price peaks or valleys occur. These points are grouped into zones representing support or resistance areas rather than precise lines. Each level is assigned a strength score based on the frequency of price touches and the clustering of key points, helping users prioritize the most significant and reliable levels.
Visualized on the chart as horizontal lines or colored zones, the indicator uses color coding to indicate the price's position relative to each level: red for resistance (price below level), green for support (price above level), and yellow when price is within the level’s range. This tool assists traders in making informed decisions on entries, exits, and stop-loss placements by highlighting where price may stop, bounce, or break with strength.
تقييمات العملاء
5 | 50 % | |
4 | 0 % | |
3 | 0 % | |
2 | 0 % | |
1 | 50 % |


