
Description
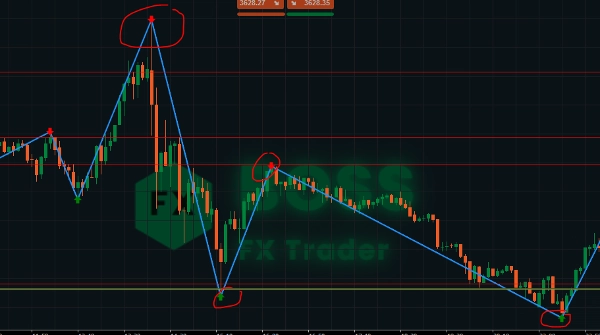
L'indicateur ZigZag est un outil de structure de marché qui filtre les petites fluctuations de prix et met en évidence les principaux sommets et creux. En reliant ces points par des lignes, les traders peuvent facilement identifier les tendances, les retournements et les figures graphiques.
Il ne génère pas de signaux d'achat/vente par lui-même, mais lorsqu'il est combiné avec l'action des prix, le support/la résistance ou d'autres indicateurs, il devient puissant pour le scalping, le trading intraday et les stratégies de swing.
🔎 Caractéristiques clés
- Simplifie le bruit du marché en montrant des oscillations claires des prix.
- Aide à identifier les niveaux de support et de résistance.
- Utile pour repérer les figures graphiques (tête et épaules, doubles sommets/bottoms, triangles).
- Aide à la confirmation de tendance et aux entrées sur retracements.
- Indicateur flèche Vente et Achat
⚡ Scalping avec ZigZag
- Périodes : 1m – 5m
- Objectif : Capturer des mouvements petits mais fréquents.
- Comment utiliser :
-
- Attendre la formation d'un nouveau sommet/creux.
- Marquer ceux-ci comme micro-support ou résistance.
- Entrer dans les trades lors des ruptures ou des retracements vers ces niveaux ZigZag.
- Placer le stop-loss juste au-delà du dernier swing (risque serré).
- Viser un TP rapide (5–15 pips selon la volatilité).
👉 Fonctionne mieux lors des sessions à haute volatilité (ouverture Londres / New York).
⏱️ Trading intraday avec ZigZag
- Périodes : 15m – 1H
- Objectif : Trader les tendances quotidiennes et les retournements clés intraday.
- Comment utiliser :
-
- Identifier la tendance intraday principale en utilisant les oscillations ZigZag plus élevées.
- Utiliser les points ZigZag comme zones pivot pour l'entrée (acheter les replis en tendance haussière, vendre les rallyes en tendance baissière).
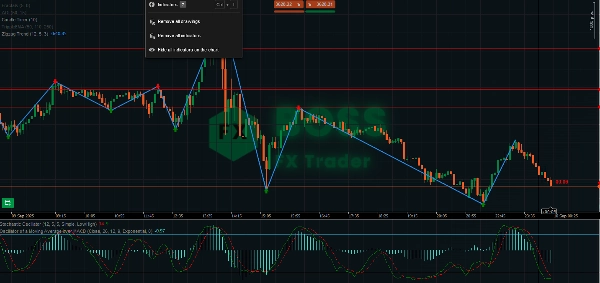
- Combiner avec des oscillateurs (RSI/Stochastique) pour confirmer les zones de surachat/survente près des extrêmes ZigZag.
- Utiliser le dernier sommet/creux précédent comme niveaux logiques de SL/TP.
👉 Idéal pour les day traders qui visent des mouvements de 20–50 pips.
📆 Swing Trading avec ZigZag
- Périodes : 4H – Daily
- Objectif : Capturer de grands mouvements de tendance et des trades de position.
- Comment utiliser :
-
- Utiliser ZigZag pour identifier la structure majeure du marché (plus hauts plus hauts & plus bas plus bas = tendance haussière).
- Entrer après les retracements lorsqu'un nouveau creux se forme dans une tendance haussière.
- Placer le SL sous le dernier creux majeur.
- Viser 2–3 fois le risque, ou le prochain niveau d'oscillation ZigZag.
- Utiliser ZigZag pour repérer les figures de retournement (double sommet/bottom, tête et épaules) pour les sorties.
👉 Idéal pour conserver les trades pendant des jours à des semaines.
📌 Astuces de pro
- Ajuster la profondeur : Plus petite = plus sensible (bon pour le scalping). Plus grande = filtre le bruit (mieux pour le swing).
- Combiner avec le volume, les filtres de tendance ou les moyennes mobiles pour confirmation.
- Toujours vérifier le ZigZag sur des périodes plus longues avant d'entrer — les petits swings à l'intérieur d'une tendance plus grande peuvent être des pièges.
- Utiliser ZigZag pour la validation des figures graphiques (triangles, wedges).
Restez des traders rentables !
Résumé
Key features include simplification of market noise, identification of support and resistance levels, trend confirmation, and assistance with pullback entries. It supports multiple trading styles across various timeframes: scalping (1–5 minutes), intraday trading (15 minutes to 1 hour), and swing trading (4 hours to daily). Users can adjust the indicator’s sensitivity to suit different trading approaches and combine it with volume or moving averages for confirmation. The tool is applicable to diverse markets including Forex, indices, commodities, stocks, and cryptocurrencies, supporting symbols like EURUSD, GBPUSD, XAUUSD, NAS100, and BTCUSD.
Avis clients
5 | 67 % | |
4 | 33 % | |
3 | 0 % | |
2 | 0 % | |
1 | 0 % |


