
Volume Meter
Indicateur
2 achats
Version 1.0, Sep 2025
Windows, Mac
5.0
Avis : 1
Depuis le 29/05/2025
3.04M
Volume tradé
45.22K
Pips gagnés
29
Ventes
768
Installations gratuites
Description
📘 Ce que fait cet indicateur
- Il affiche le volume de ticks (nombre de changements de prix par barre) sous forme d’histogramme.
- En Forex, les courtiers fournissent rarement le volume réel échangé, donc le volume de ticks est utilisé comme substitut.
- Sur les actions/CFD/futures, vous pouvez obtenir le volume réel.
- Il superpose une moyenne mobile du volume (par défaut sur 20 périodes).
- Cela sert de « ligne de base » pour repérer rapidement si le volume de la barre actuelle est anormalement élevé ou faible.
🎯 Comment l’utiliser comme confirmation
L’indicateur n’est pas un générateur de signaux autonome. Au lieu de cela, les traders l’utilisent pour confirmer des configurations issues d’autres stratégies :
- Confirmation de cassure
-
- Si le prix franchit une résistance à la hausse ou un support à la baisse, vérifiez si la bougie de cassure a un volume supérieur à sa moyenne mobile.
- Un volume élevé confirme que plus de participants soutiennent le mouvement → la cassure est plus fiable.
- Une cassure à faible volume = risque plus élevé de fausse cassure.
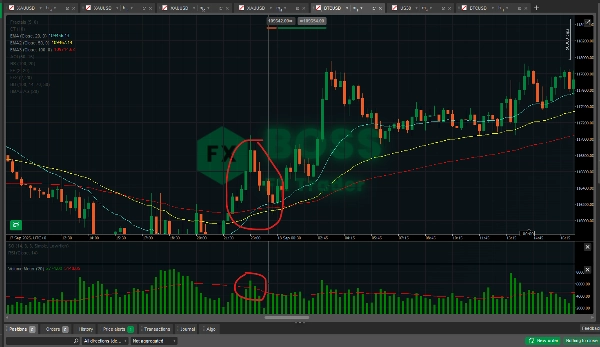
- Continuation de tendance vs épuisement
-
- Dans une tendance forte, les bougies de retracement ont souvent un volume plus faible comparé aux bougies impulsives.
- Si un retracement se produit avec un faible volume et que le mouvement suivant reprend avec un volume plus élevé → cela confirme la continuation de la tendance.
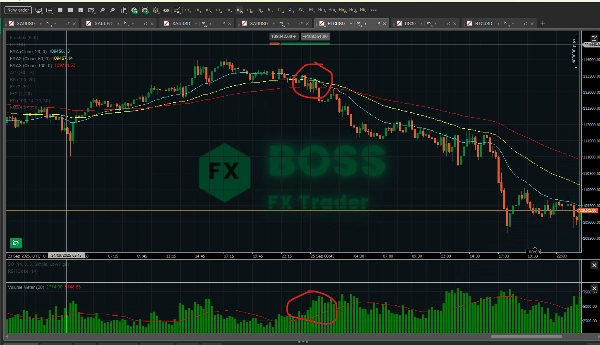
- Si vous voyez la poussée de la tendance continuer mais que le volume diminue à chaque poussée → possible épuisement, préparez-vous à un retournement.
- Confirmation de retournement
-
- Les grandes bougies de retournement (pin bars, bougies englobantes, fractales) sont plus fortes si elles sont soutenues par un pic de volume.
- Exemple : un pin bar haussier au support avec un volume élevé = signal de retournement plus fort qu’un même pin bar avec un faible volume.
- Filtre de faux signaux
-
- Si votre système principal donne un signal d’achat/vente, mais que le volume est faible (en dessous de la moyenne), vous pouvez choisir de ne pas prendre ce trade.
- Cela aide à réduire le sur-trading et à filtrer le bruit.
📊 Efficacité
- En Forex : Le volume de ticks a montré une forte corrélation avec le volume réel échangé (corrélation de 70 à 90 % dans de nombreuses études). Il est donc utile, mais pas parfait.
- Sur actions/futures/CFD : Le volume réel rend cet indicateur beaucoup plus puissant car vous mesurez les contrats/actions réellement échangés.
- Comme confirmation : Il est préférable de l’utiliser avec l’action des prix et d’autres indicateurs (par ex., EMA, RSI, fractales). Se fier uniquement au volume est risqué.
- Points forts : Confirme les cassures, filtre les faux mouvements, détecte l’épuisement.
- Points faibles : Ne prédit pas la direction seul — ajoute seulement de la confiance une fois que vous avez une configuration.
✅ Conseil pratique :
Utilisez l’indicateur comme filtre, pas comme déclencheur. Par exemple :
- Vous voyez un croisement de l’EMA (signal d’achat).
- Vérifiez : le volume est-il au-dessus de sa moyenne mobile ? Si oui → prenez le trade. Sinon → attendez.
De cette façon, vous ne tradez que lorsque le momentum est soutenu par la participation du marché.
Résumé
Résumé IA
Volume Meter is a trading indicator that displays tick volume—the number of price changes per bar—as a histogram. In Forex markets, where real traded volume data is often unavailable, tick volume serves as a proxy, while in stocks, CFDs, and futures, real volume data may be used. The indicator overlays a moving average of volume (default 20-period) to provide a baseline, helping traders identify whether current volume is unusually high or low.
This tool is designed to confirm trading setups rather than generate standalone signals. It assists in validating breakouts by checking if breakout candles have volume above their moving average, indicating stronger market participation. It also helps distinguish trend continuation from exhaustion by comparing volume levels during pullbacks and impulse moves. Additionally, it supports reversal confirmation by highlighting volume spikes on significant reversal candles and filters false signals by advising caution when volume is weak despite buy or sell signals from other systems.
Volume Meter is applicable across various markets including Forex, stocks, indices, commodities, and cryptocurrencies. Its effectiveness is enhanced when combined with price action and other indicators such as EMA or RSI. The indicator aids in improving trade decision confidence by integrating volume analysis as a confirmation and filtering tool.
Profil de l'indicateur
Avis clients
5.0
Avis : 1
5 | 100 % | |
4 | 0 % | |
3 | 0 % | |
2 | 0 % | |
1 | 0 % |
Avis clients
October 1, 2025
the first 10 trades should stay boring, and the checklist becomes easier to follow.
Discussion
Questions fréquentes
BTCUSD
Forex
Breakout
Indices
EURUSD
Commodities
GBPUSD
NZDUSD
Prop
Supertrend
Crypto
Stocks
XAUUSD
NAS100
USDJPY
Les produits disponibles sur cTrader Store, notamment les bots de trading, les indicateurs et les plug-ins, sont fournis par des développeurs tiers et mis à disposition à titre informatif et à des fins d'accès technique uniquement. cTrader Store n'est pas un courtier et ne fournit aucun conseil en investissement, aucune recommandation personnelle ni aucune garantie quant aux performances futures.


Prix
Depuis le 29/05/2025
3.04M
Volume tradé
45.22K
Pips gagnés
29
Ventes
768
Installations gratuites