

FiboTrend-Pro V2
Indicateur
1 achats
Version 1.0, Jun 2025
Windows, Mac
5.0
Avis : 1

150
Ventes
11.33K
Installations gratuites
Description
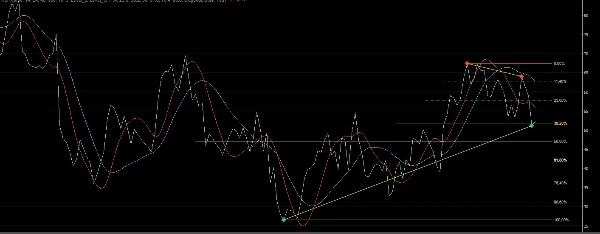
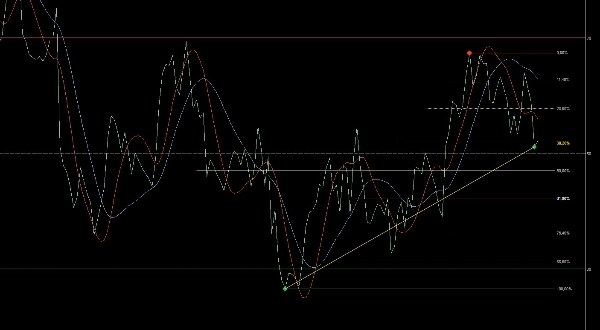
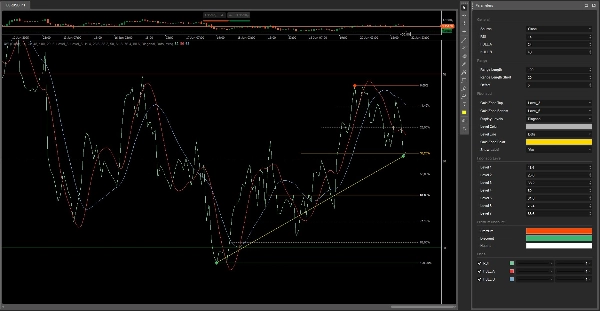
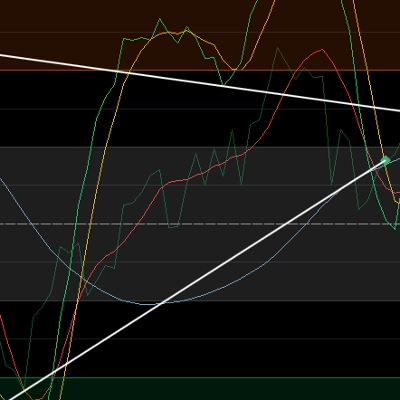
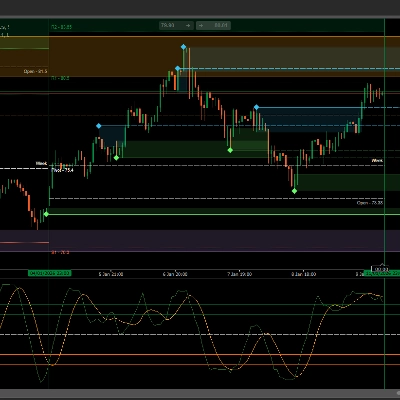
Fibo Trend - Pro est basé sur les célèbres indicateurs RSI, HULL et Fibonacci pour vous offrir un outil d'analyse technique avancé qui vous aidera à identifier les tendances ainsi que les points d'entrée et de sortie du marché. Cet indicateur combine la puissance du RSI pour mesurer la force de la tendance, du HULL pour lisser les mouvements de prix, et de Fibonacci pour identifier les niveaux clés de support et de résistance.
TSPivotSMC-V2 : https://ctrader.com/products/3137?u=Thomas-Sparrow
RangeBoxFibonacci : https://ctrader.com/products/526
OrderPrice-V3 : https://ctrader.com/products/397
Et pour choisir
MacdVolume https://ctrader.com/products/267
MarketSession-MX : https://ctrader.com/products/525
Résumé
Résumé IA
FiboTrend-Pro V2 is a technical analysis indicator that integrates the Relative Strength Index (RSI), Hull Moving Average (HULL), and Fibonacci indicators. It is designed to assist traders in identifying market trends and optimal entry and exit points. The RSI component measures trend strength, the HULL indicator smooths price movements to reduce noise, and Fibonacci levels highlight key support and resistance areas. This combination provides a comprehensive tool for analyzing price action across various markets including Forex, indices, commodities, cryptocurrencies, and stocks. The indicator supports multiple timeframes and is suitable for traders seeking to enhance their market timing using established technical methods.
Profil de l'indicateur
Avis clients
5.0
Avis : 1
5 | 100 % | |
4 | 0 % | |
3 | 0 % | |
2 | 0 % | |
1 | 0 % |
Avis clients
August 28, 2025
Improved swing detection, cleaner interface, stable performance.FiboTrend-Pro V2 is a valuable improvement, especially for swing and position traders
Discussion
Questions fréquentes
Forex
Indices
Commodities
RSI
Crypto
Stocks
Les produits disponibles sur cTrader Store, notamment les bots de trading, les indicateurs et les plug-ins, sont fournis par des développeurs tiers et mis à disposition à titre informatif et à des fins d'accès technique uniquement. cTrader Store n'est pas un courtier et ne fournit aucun conseil en investissement, aucune recommandation personnelle ni aucune garantie quant aux performances futures.

























Prix
150
Ventes
11.33K
Installations gratuites