
Description
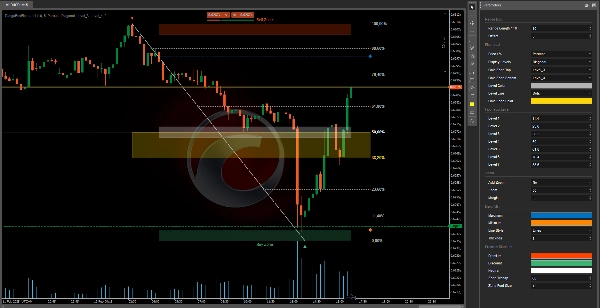
Cet indicateur de retracement de Fibonacci permet aux traders de visualiser et de personnaliser les niveaux clés de retracement afin d'identifier les zones potentielles d'achat et de vente sur le marché.
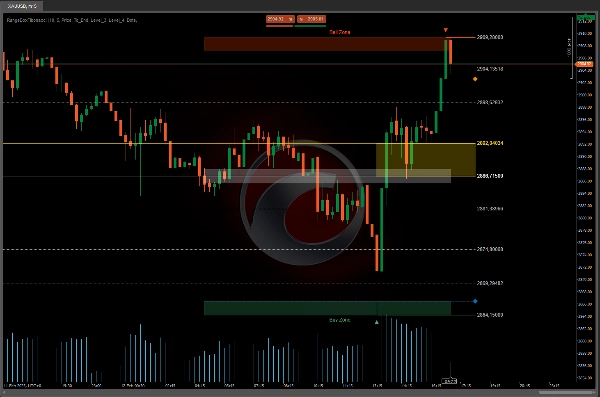
En plus des "Zones de Vente" et "Zones d'Achat" colorées, les utilisateurs peuvent ajuster les niveaux de Fibonacci selon leurs préférences.
Cet indicateur est complété par un indicateur d'alertes séparé pour une expérience de trading plus complète.
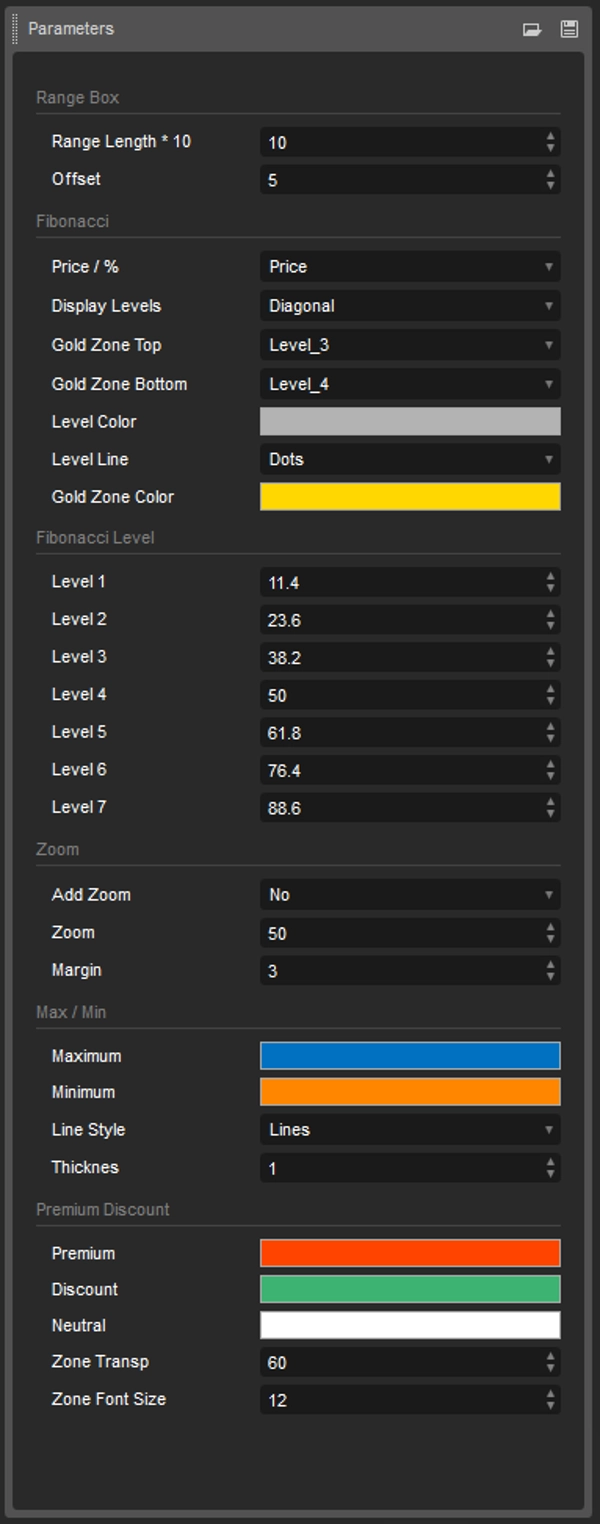
Avec cet indicateur de retracement de Fibonacci, les traders ont un contrôle total sur les niveaux de retracement affichés sur le graphique.
La possibilité de personnaliser les niveaux de Fibonacci, ainsi que les zones colorées et un indicateur d'alertes séparé, permet aux utilisateurs d'adapter l'outil à leurs stratégies de trading individuelles.
Si vous incluez des outils tels que :
- OrderPrice V3 https://ctrader.com/products/397
- NTMPICLL https://ctrader.com/products/327
- MACDVolume https://ctrader.com/products/267
- MarketSession-MX https://ctrader.com/products/525
Il est impossible de perdre beaucoup d'argent.
Résumé
Avis clients
5 | 50 % | |
4 | 50 % | |
3 | 0 % | |
2 | 0 % | |
1 | 0 % |


