
Açıklama
CVD ai
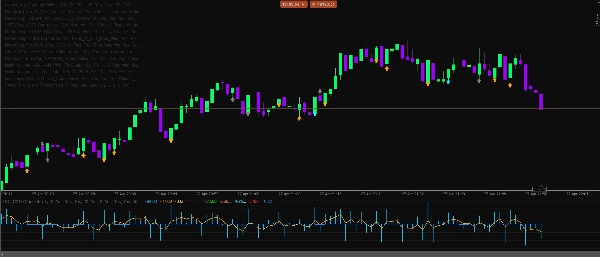
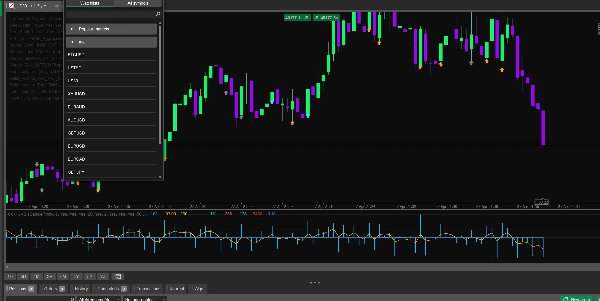
Delta CVD Advanced, piyasa davranışından doğrudan alım ve satım baskısını daha net görmek isteyen tüccarlar için tasarlanmış profesyonel bir momentum ve emir analiz göstergesidir. Delta, CVD, canlı tik momentumu, absorpsiyon, uyumsuzluk, oturum filtreleri, volatilite koruyucuları ve akıllı bir örtüşme motorunu tek bir temiz analiz aracında birleştirir.
Bu gösterge, Forex, Altın, Endeksler, Kripto ve Petrol piyasalarında scalping, günlük işlem ve kısa vadeli momentum onayı için oluşturulmuştur.
Ana Özellikler
- Uptick/downtick mantığı kullanarak canlı Delta hesaplaması
- Tarihsel analiz için mum vekil delta modu
- Zaman içinde baskıyı takip etmek için Kümülatif Hacim Delta çizgisi
- Daha temiz momentum okumaları için düzeltilmiş Delta çizgisi
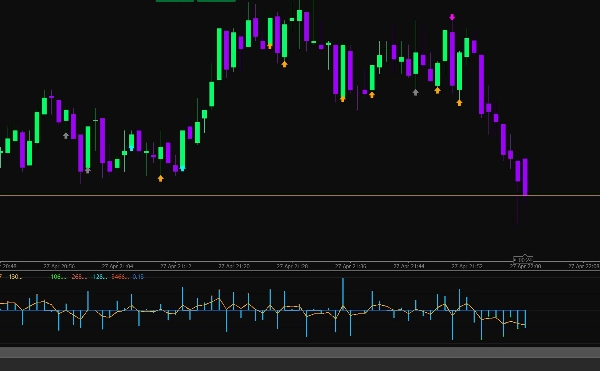
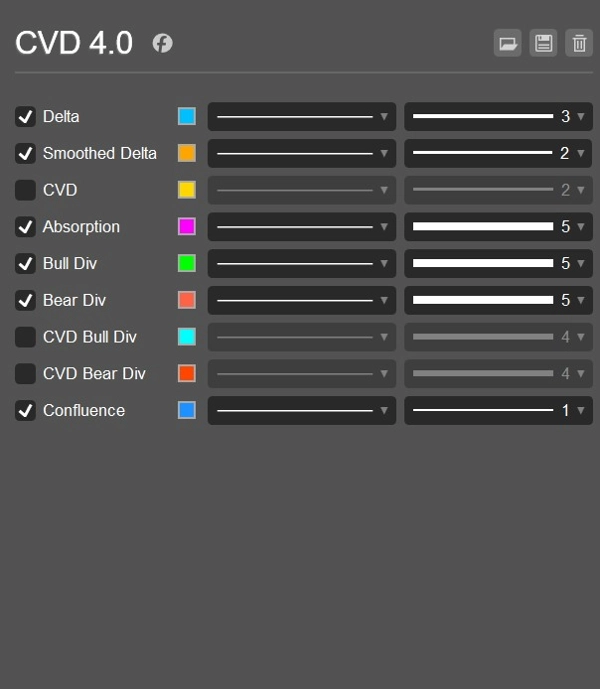
- Alış/Satış renkli Delta histogramı
- Canlı piyasa impulsu için tik tabanlı momentum hesaplaması
- CVD eğimi ve tik impulsunu birleştiren hibrit momentum modu
- CVD sıfırlama seçenekleri: Asla, Günlük veya Oturum bazında
- Boğa ve ayı Delta uyumsuzluğu tespiti
- Boğa ve ayı CVD uyumsuzluğu tespiti
- Fiyatı hareket ettiremeyen baskıyı tespit etmek için absorpsiyon algılama
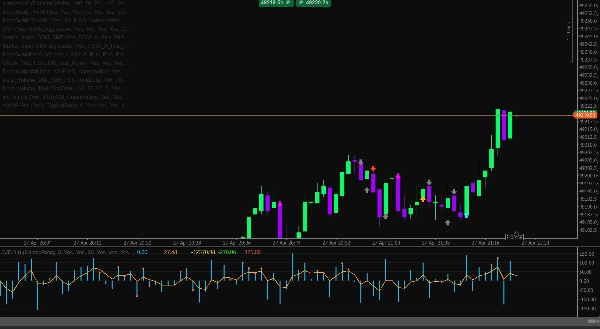
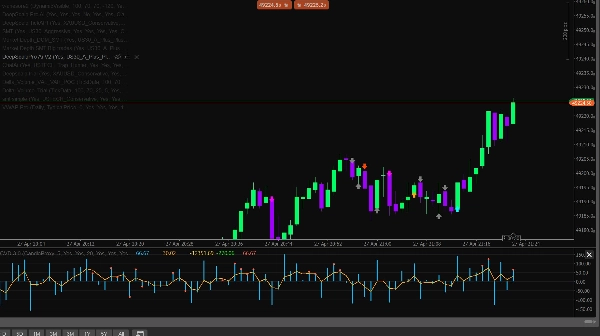
- ALIŞ ve SATIŞ fırsatları için sinyal okları
- Erken momentum değişikliği uyarıları için tahmin okları
- Sinyaller için isteğe bağlı CVD onayı
- Yönsel puanlama ile akıllı örtüşme motoru
- DOM vekil baskı filtresi
- Likidite yakalamaları için süpürme algılama filtresi
- Asya, Londra ve New York oturum filtreleri
- UTC zamanı kullanarak otomatik oturum algılama
- ATR limitleri kullanarak volatilite koruyucu
- Kötü piyasa koşullarından kaçınmak için spread koruyucu
- Zayıf düşük hacimli sinyallerden kaçınmak için hacim oranı filtresi
- Forex, Altın, Endeksler, Kripto ve Petrol için sembol ön ayarları
- US30 M1, USTECH M1, XAUUSD M1, BTCUSD M1 ve Petrol M1 için strateji şablonları
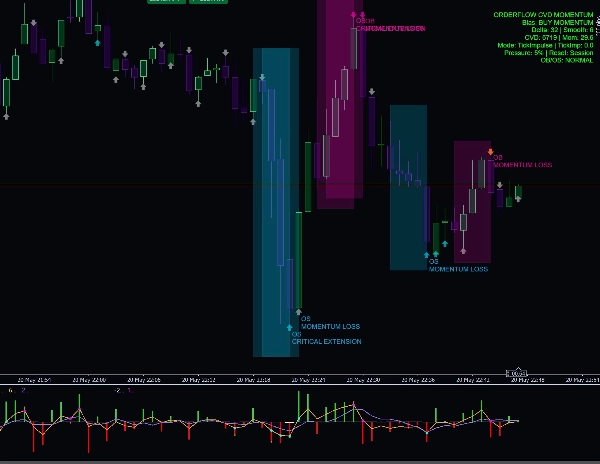
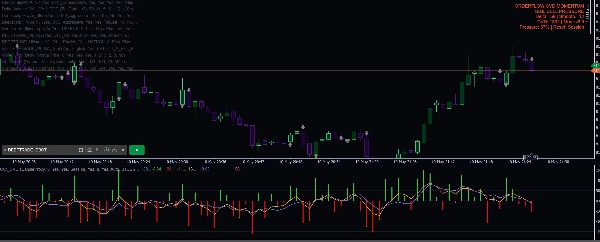
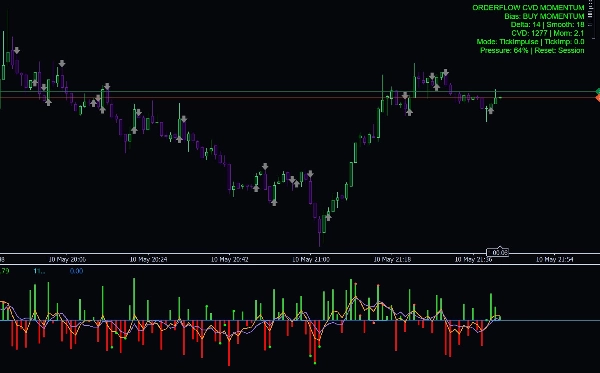
- Önyargı, Delta, Düzeltilmiş Delta, CVD, Momentum, baskı yüzdesi ve sıfırlama modu gösteren bilgi paneli
- Soğuma kontrolü ile isteğe bağlı günlük uyarılar
Tüccarların Kullanma Nedenleri
Delta CVD Advanced, tüccarların şu anda kontrolün kimde olduğunu anlamalarına yardımcı olur: alıcılar mı yoksa satıcılar mı. Sadece fiyat mumlarına güvenmek yerine, gösterge hareketin arkasındaki baskıyı analiz eder. Bu, girişleri onaylamak, zayıf sinyallerden kaçınmak, dönüşleri tanımlamak, absorpsiyonu tespit etmek ve momentum değişikliklerini fiyat üzerinde belirgin hale gelmeden önce fark etmek için faydalıdır.
Tik momentum modu, gerçek zamanlı fiyat impulslarına tepki verdiği için canlı scalping için özellikle faydalıdır; CVD ve düzeltilmiş delta araçları ise hareketin arkasında gerçek güç olup olmadığını doğrulamaya yardımcı olur.
En İyi Kullanım Alanları
- Scalping
- Gün içi işlem
- Momentum onayı
- Dönüş onayı
- Likidite süpürme analizi
- Delta ve CVD uyumsuzluk ticareti
- Altın, Endeksler, Kripto, Petrol ve Forex çiftleri
- M1, M5 ve diğer daha düşük zaman dilimleri
Önemli Uyarı
Bu gösterge, analitik karar destek aracıdır. Kar garantisi vermez ve uygun risk yönetimi, piyasa yapısı ve test edilmiş bir ticaret planı ile birlikte kullanılmalıdır.
Özet
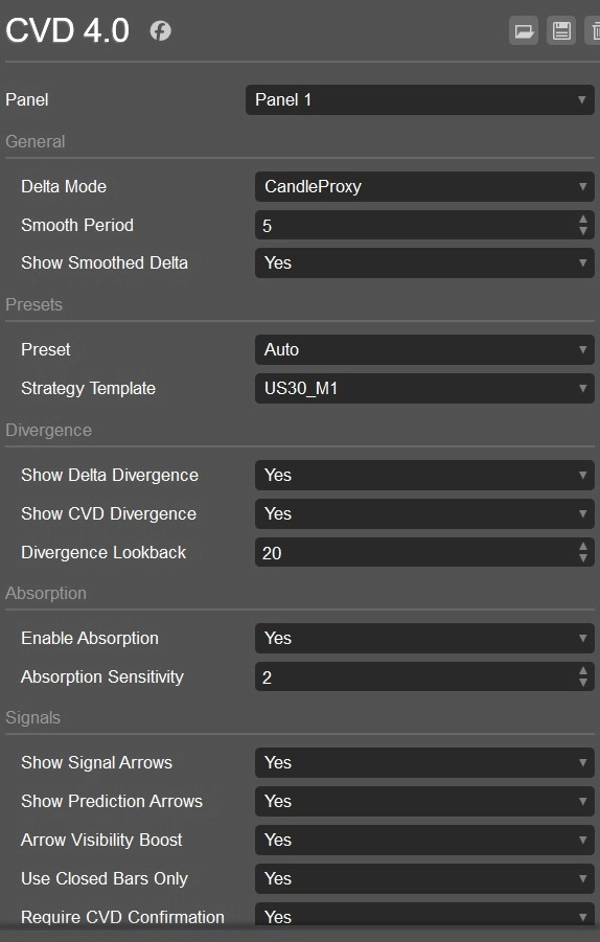
Additional functionalities include detection of bullish and bearish Delta and CVD divergences, absorption detection to identify pressure that fails to move price, and signal arrows for buy/sell opportunities alongside prediction arrows for early momentum shifts. It incorporates session filters for Asia, London, and New York trading sessions, volatility and spread guards, volume ratio filters, and a smart confluence engine with directional scoring.
CVD Ai supports markets such as Forex, Gold, Indices, Crypto, and Oil, and is optimized for scalping, intraday trading, and short-term momentum confirmation on lower timeframes like M1 and M5. It offers strategy templates for specific symbols including US30, USTECH, XAUUSD, BTCUSD, and Oil. The indicator includes an info dashboard displaying bias, Delta, smoothed Delta, CVD, momentum, pressure percentage, and reset mode options.
Müşteri değerlendirmeleri
5 | 0 % | |
4 | 100 % | |
3 | 0 % | |
2 | 0 % | |
1 | 0 % |


